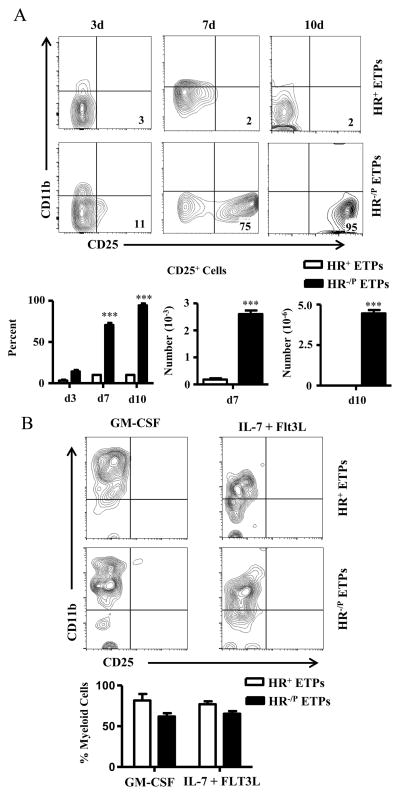
Figure 1. HR+ETPs are fixed to myeloid lineage maturation.
Thymic cells from HR+/+ mice expressing GFP under the IL-13Rα1 promoter were depleted of lineage-positive cells and the CD25−CD44+c-Kit+ ETPs (Lin− CD4− CD8− CD25− CD44+ c-Kit+) were sorted and further separated into (GFP+) HR+ and (GFP−) HR−/P (which have the genetic potential to up-regulate the HR) by flow cytometry. (A) HR+ and HR−/PETPs (3 x 10³ cells per well) were cultured on OP9-DL1 stromal cells in the presence of IL-7+Flt3L for the indicated days and maturation into the T cell lineage was assessed by expression of CD25. All cells were gated on CD45+ and 7-AAD− to exclude stromal and dead cells. Contour plots are representative experiments and the numbers indicate cell percentages. The bar graphs show the percentage (left panel) and number (right panel) of CD25+ cells for the indicated time points compiled from 4 independent experiments. Each bar represents the mean ± SD for each population. ***p<0.001 as analysed by two-tailed, unpaired Student’s t-test. (B) HR+ and HR−/PETPs were cultured (3 x 10³ cells per well) on OP9 stromal cells for 3 days in the presence of the indicated growth factors and maturation into myeloid lineages was assessed by CD11b expression by cells gated on CD45+ and 7-AAD−. Contour plots are representative experiments and the numbers indicate cell percentages. The bar graphs show compiled data from 4 independent experiments. The percent cells represent the mean ± SD for each population.

