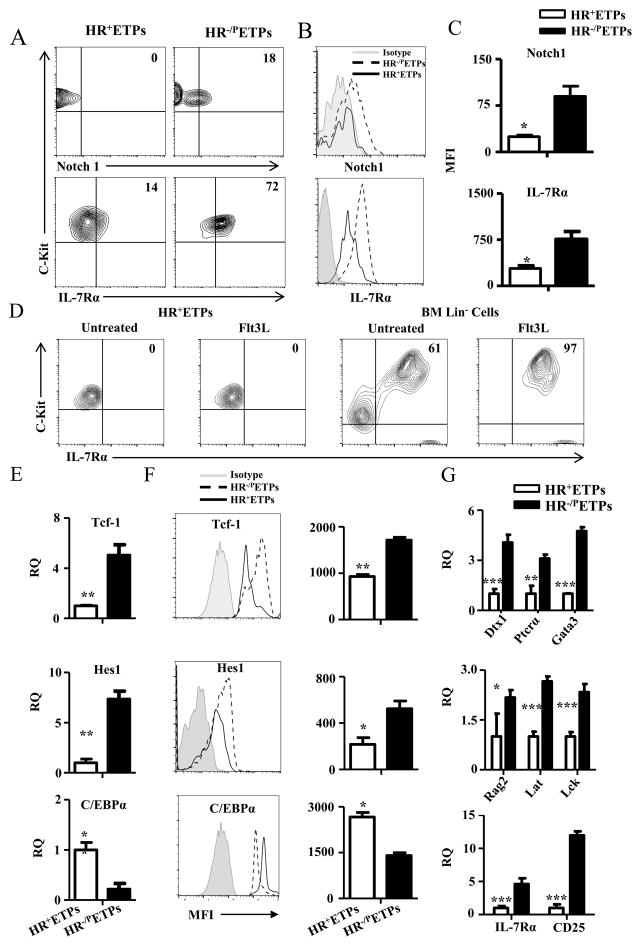
Figure 3. HR+ETPs display impaired expression of factors required for T cell lineage maturation.
(A, B) Thymic cells from IL-13Rα1-GFP reporter mice were depleted of Lin+ cells and the Lin−CD4−CD8− were stained with antibodies to CD25, CD44, c-Kit, and Notch1 or IL7Rα. The CD25−CD44+c-Kit+GFP+ (HR+ETPs) and CD25−CD44+c-Kit+GFP− (HR−/PETPs) were analysed for Notch1 and IL-7Rα expression. (A) Shows contour plots and (B) shows histograms for Notch1 and IL-7Rα expression. The numbers in the contour plots represent cell percentages. (C) Shows MFI data for Notch1 and IL-7Rα expression compiled from 3 independent experiments. *p<0.05 as analysed by a paired t-test. (D) GFP sorted HR+ETPs and MACS purified Lin− BM control cells were cultured in vitro with or without Flt3L for 72hrs, and the cells gated on CD45 were analysed for c-Kit and IL-7Rα expression. The numbers represent cell percentages. (E) HR+ETPs isolated from IL-13Rα1-GFP reporter mice were analysed for expression Tcf-1, Hes1 and C/EBPα by real-time PCR in comparison to HR−/PETPs counterparts. The data shows mRNA expression (RQ) relative to GAPDH housekeeping gene. (F) Shows MFI for Tcf-1, Hes1 and C/EBPα protein expression by thymic cells gated on CD25−CD44+c-Kit+GFP+(HR+ETPs) and CD25−CD44+c-Kit+GFP− (HR−/PETPs). The histograms illustrate data from a representative experiment and the bar graphs show compiled results from 3 independent experiments. *p<0.05 and **p<0.01 as determined by a paired t-test. (G) Shows mRNA expression relative to GAPDH for the indicated genes in sorted HR+ and HR−/PETPs. The bars represent the mean ± SD data compiled from 3 independent experiments. *p<0.05, **p<0.01 and ***p<0.001 as determined by two-tailed, unpaired Student’s t-test.

