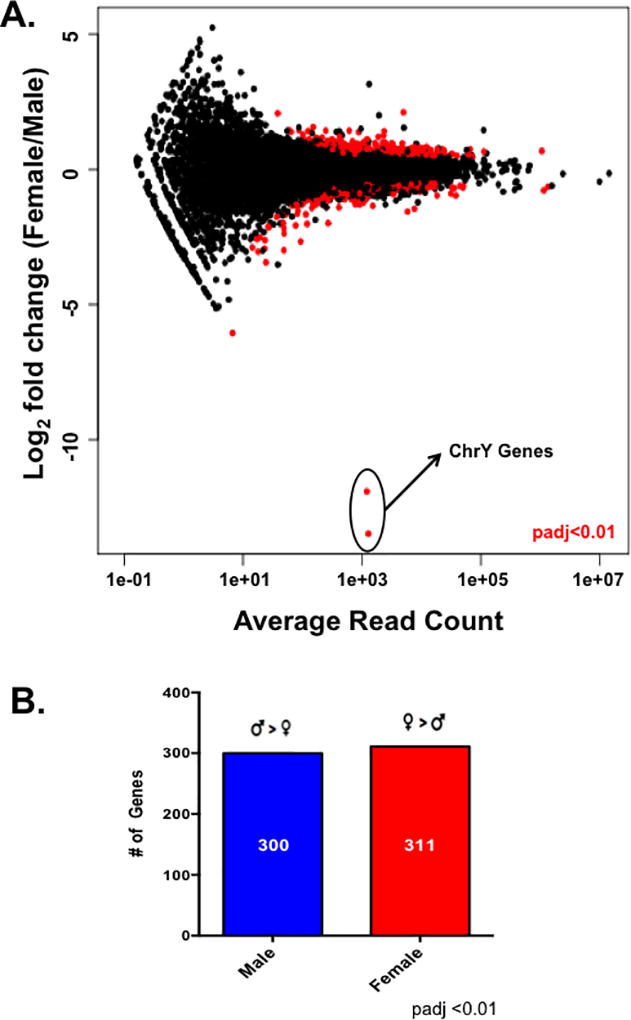
Figure 2. Male and female cardiac myocytes exhibit different transcriptome profiles.

(A) Differential gene expression analysis between male and female cardiac myocytes as measured with DESeq. Differentially expressed genes between the sexes are indicated by the red circles; padj <0.01 female relative to male, N=5 female and 6 male isolated cardiac myocyte preparations. (B) The number of differentially expressed genes (padj<0.01) genes at least 1.5× higher in one sex relative to the other as measured by DESeq; this list of genes was used for downstream analysis with IPA.
