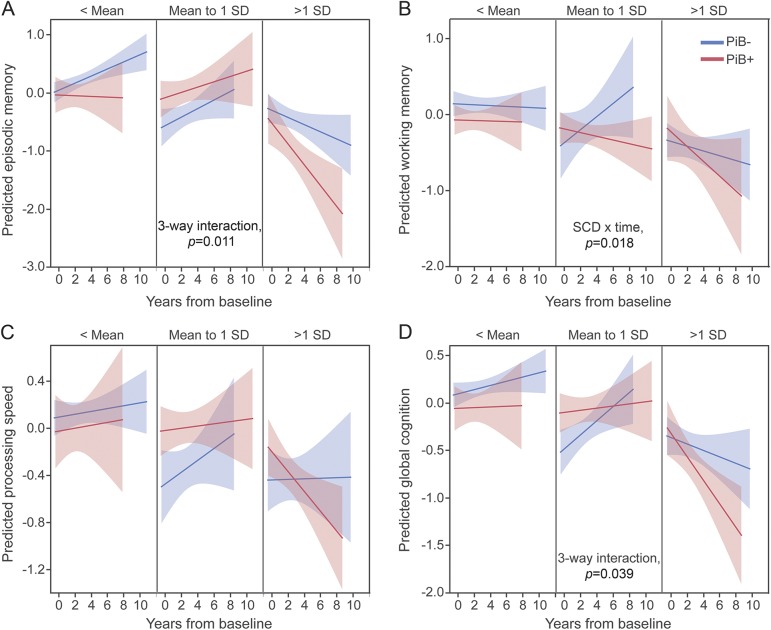
Figure 2. Interactions between PiB status and SCD severity on rate of cognitive change over time.
(A) Episodic memory, (B) working memory, (C) processing speed, and (D) global cognition. The y-axis of each plot represents the cognitive factor values predicted by the models; the x-axis represents time from baseline. To visualize 3-way interactions, cognition over time is presented separately for PiB− (blue) and PiB+ (red) groups. These relationships are further split at differing levels of SCD score (panels). Because SCD is a population-normalized variable, panels represent splits in reference to the mean and SD. This is meant only to aid in interpretation of the results. In the actual models, SCD was entered as a scalar variable. Main effects and interactions of interest are given in table 2. GDS = Geriatric Depression Scale; PiB = Pittsburgh compound B; SCD = subjective cognitive decline.

