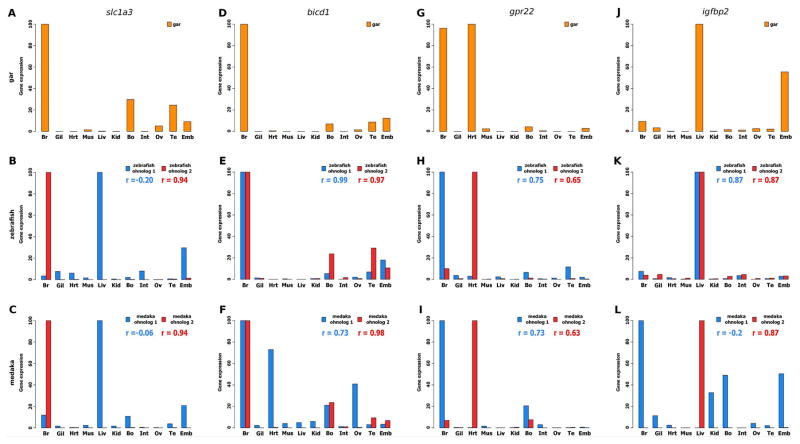
Figure 2. Examples of conserved neofunctionalized and subfunctionalized ohnologs in zebrafish and medaka, based on expression pattern comparisons with their gar orthologs.
Examples of neofunctionalized TGD ohnologs: (A–C) slc1a3: solute carrier family 1 member 3; (D–F) bicd1: bicaudal D homolog 1. Examples of subfunctionalized TGD ohnologs: (G–I) gpr22: G protein coupled receptor 22; (J–L) igfbp2: insulin-like growth factor binding protein 2. Each graph shows the correlation (r) of gene expression profiles between gar and each of the two ohnologs. For each graph the bars show the expression levels (DESeq normalized read counts) obtained from the gar, zebrafish, and medaka libraries of the PhyloFish database http://phylofish.sigenae.org/index.html (Pasquier et al., 2016). For all genes, expression is shown in brain (Br), gills (Gil), heart (Hrt), muscle (Mus), liver (Liv), kidney (Kid), bones (Bo), intestine (Int), ovary (Ov), testis (Te), and in a pool of embryos at eyed stage (Emb).

