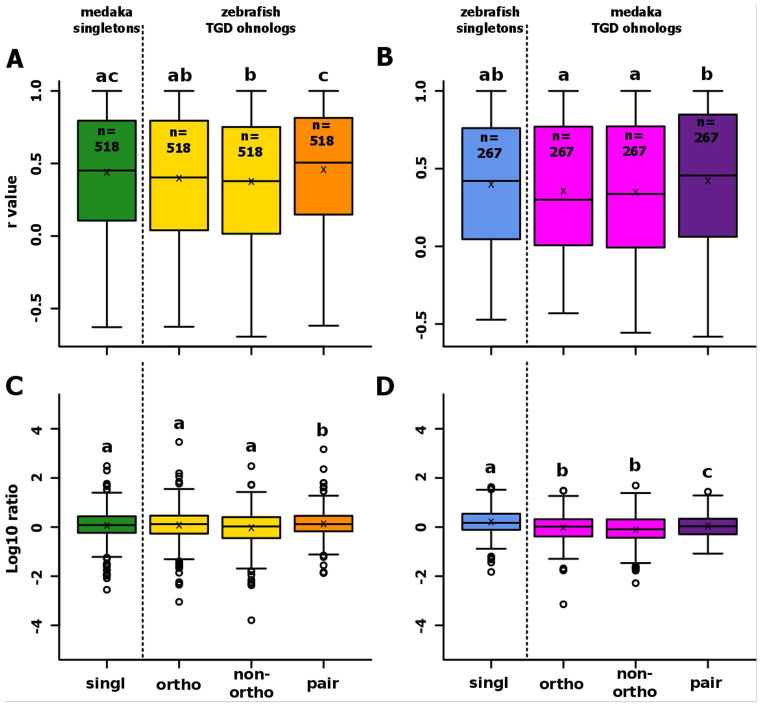
Figure 4. Conservation of expression after the TGD for genes conserved as duplicates in one teleost and as a singleton in the other teleost.
Boxplots representing the distribution of correlations between gene expression patterns in gar and their ortholog(s) in zebrafish (A) or medaka (B). Boxplots representing the distribution of the ratio between the gene expression level of genes in gar and their ortholog(s) in zebrafish (C) or medaka (D). For each boxplot, the black line, the black cross, and the black circle represent the median, the mean and the outliers, respectively. ‘Ohno-pair’ represents the average expression profile of a pair of ohnologs as defined in Additional File 1. It needs to be pointed out in the figure that the orthology relations are now different between the two yellow/pink bars to the green/blue one, which is different from Fig. 3.

