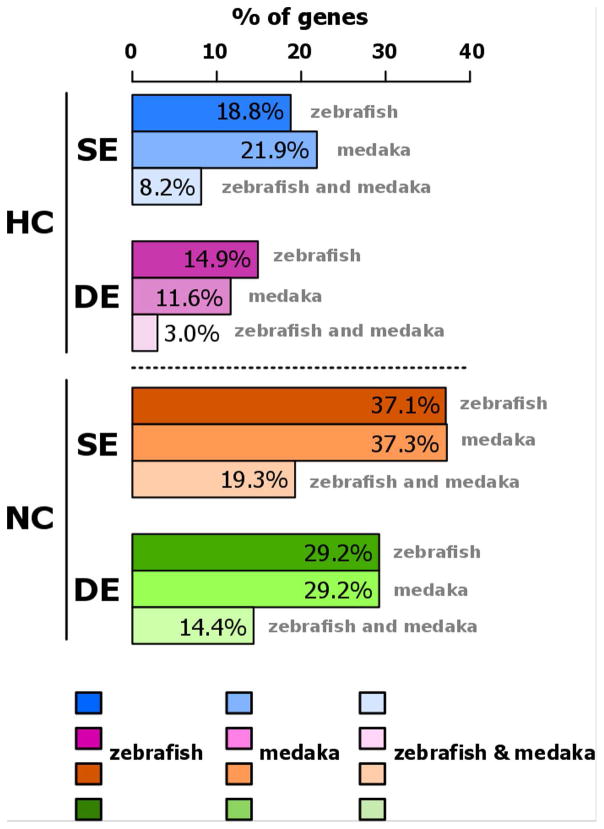
Figure 6. Expression of conserved TGD ohnologs in zebrafish and medaka reveals four classes of genes based on the conservation of their expression profiles.
Determination of four groups of ohnologs based on (i) correlation between their expression patterns (HC: high correlation, p > 0.05; NC: no correlation, p < 0.05, Pearson’s correlation test), and (ii) their relative expression levels (SE: similar expression levels, p > 0.05; DE: different expression levels, p < 0.05, Student’s t-test). The percentage of genes present in each class (HCSE, HCDE, NCSE, and NCDE) is shown for zebrafish, medaka, and for genes belonging in the same class for the two species.

