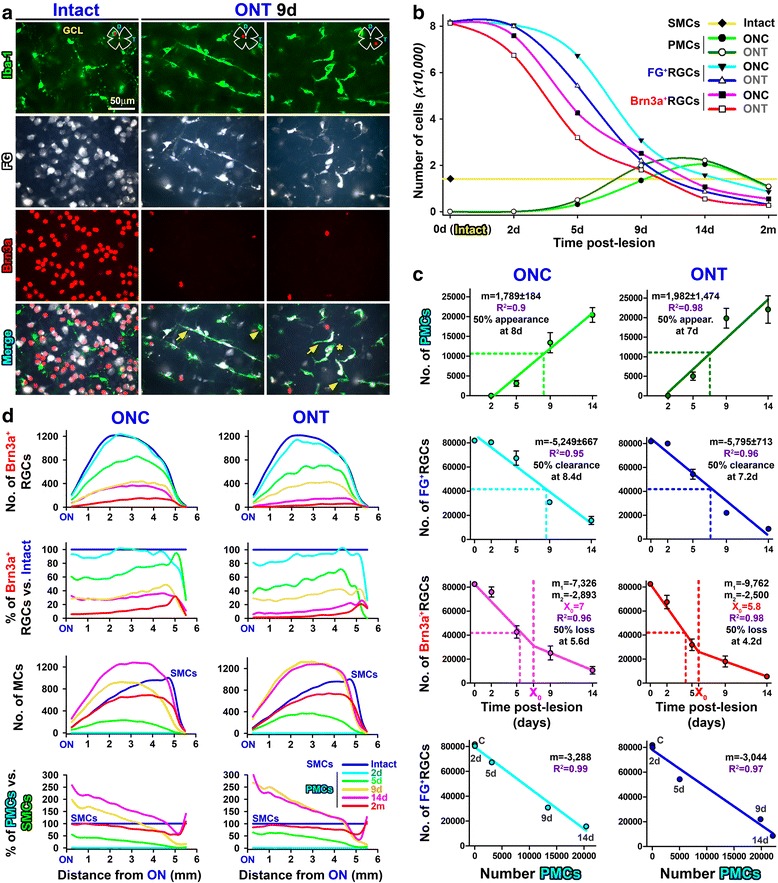
Fig. 3.

Microglial cell morphologies, quantitative topography, and correlation analyses of PMC appearance, RGC clearance, and RGC death. a Microglial cells in control or axotomized retinas: magnifications from control or injured FG-traced retinas immunodetected for Iba1 and Brn3a taken from the red areas shown in the retinal drawing. Arrows, PMCs. Arrowheads, activated MCs that have not yet engulfed a traced RGC. Asterisk, MC engulfing a traced RGC that has lost its Brn3a expression. b Temporal course of RGC loss and PMC appearance. The yellow line is the number of SMCs in intact retinas. c Correlation analyses created from total mean numbers ± standard deviation. First row, PMCs vs. time; lineal fit. Second row, FG+RGCs vs. time; lineal fit. Third row, Brn3a+RGCs vs. time; lineal segmental fit. Fourth row, FG+RGCs vs. PMCs; lineal fit. R 2 is the correlation coefficient. m is the slope of the straight line. X 0 is the day when the first linear phase of RGC loss changes to a second, slower one. m 1 and m 2 are the slopes of the first and second linear phases, respectively. Fifty percent appearance, clearance, or loss is the time (days) when, according to the mathematical analysis, half of the PMCs have appeared, half of the RGCs have been cleared from the tissue, or half of the RGCs have died, respectively. Left column ONC, right column ONT. d Quantitative topography. Line graphs where the mean number or percent of cells (Y-axis) counted after ONC (left column) or ONT (right columns) are plotted against the length of the retina (X-axis) being 0 the optic nerve and 6 mm the periphery. First row, number of Brn3a+RGCs. Second row, Brn3a+RGCs as percent of intact retinas (blue line). Third row, number of MCs, which are surveying MCs for intact retinas and PMCs for injured ones. Fourth row, percent of PMCs, being 100% the number of SMCs in intact retinas (blue line)
