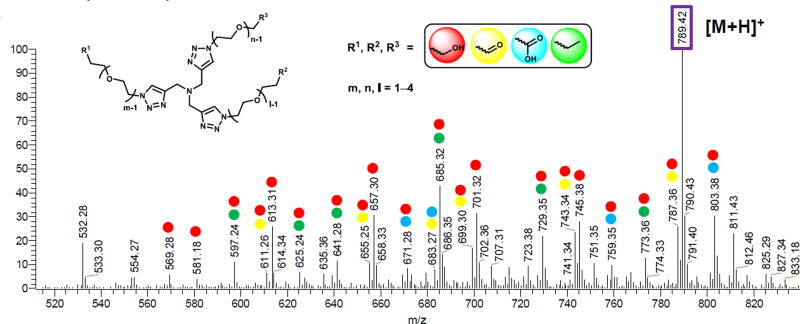
Fig. 7.
Total ion mass spectrum of ligand 1 fragments (total ion). The spectrum was obtained from the 60 min CuAAC reaction mixture containing the peptides by zoom in the region of m/z = 520–840 and retention time from 5–7 min. The experimental condition is given in ESI†. The oligo ethylene glycol (OEG) unit is designated as the [m,n,l] system where m, n, l = 1–4. The labeled peaks were summarized in Table S4, ESI† (Red: alcohol derivatives; Yellow: aldehyde derivatives; Blue: acid derivatives; Green: ether derivatives).82, 83 The single and multiple labeling represents the single and multiple components of the ligand fragments, respectively.

