
Figure 5.
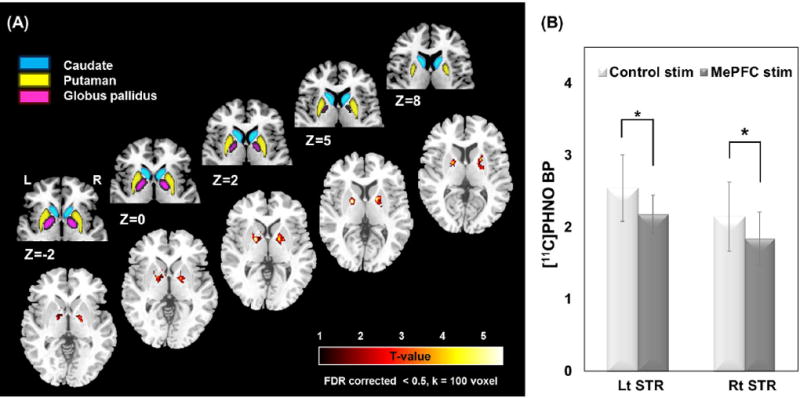
Release of dopamine is assessed using PET following rTMS of the medial prefrontal cortex. Release is demonstrated by a reduction in [11C]-(+)-PHNO binding. Part a shows an anatomical representation of the basal ganglia (upper row) and the t-value of the release highest in the bilateral dorsal putamen (DPu) and bilateral dorsal/ventral globus pallidus (GP) (lower row). Quantification of the reduction in the striatum is illustrated in part b. This observation shows that the prefrontal-striatal fibers can modulate release of dopamine. Image from (Cho et al., 2015) with permission.