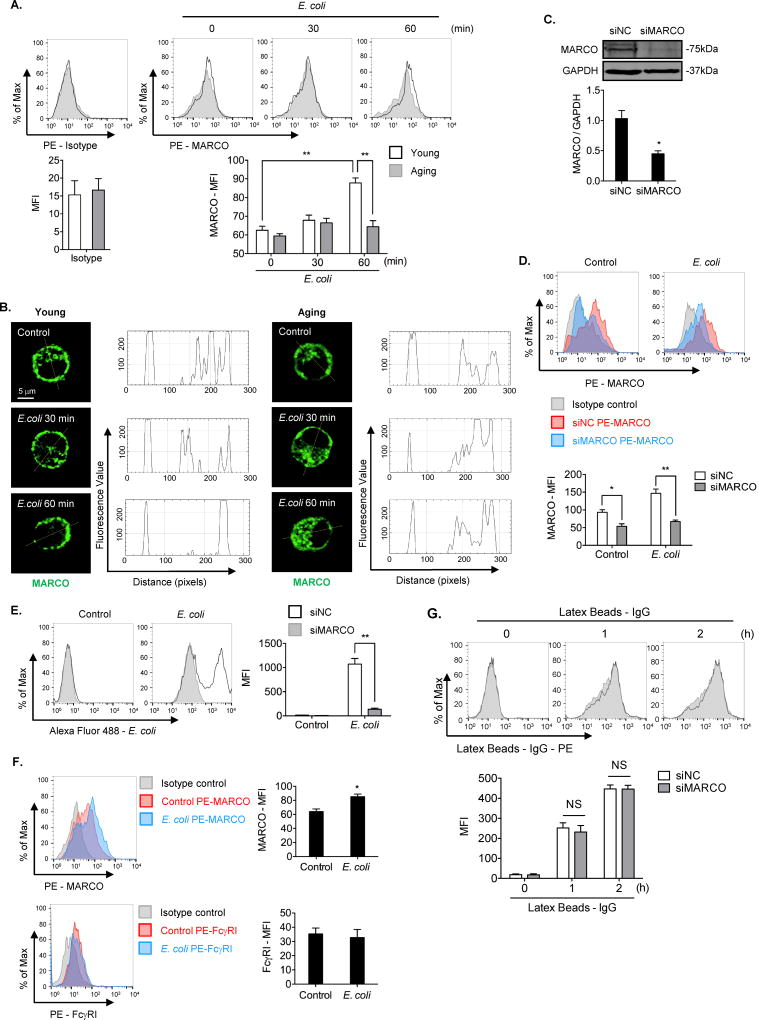
Figure 2. Upregulated MARCO cell surface expression is required for AMϕ phagocytosis of E. coli.
(A) Young and aging AMϕ were treated with Alexa Fluor 488-conjugated E. coli (MOI=4) for up to 60 min. Cell surface MARCO stained with PE-MARCO antibody was measured by flow cytometry and expressed as mean fluorescence intensity (MFI). PE-Isotype staining was used as staining control. The graph shows mean ± SEM of MFI, n=3. Statistical analysis using two-way ANOVA, Interaction p = 0.0014. Tukey’s multiple comparisons test shows that 0min/Young vs. 60min/Young, p = 0.0001; 60min/Young vs. 60min/Aging, p = 0.0003. (B) Young and aging AMϕ were treated with E. coli (strain BL21, MOI=4) for up to 60 min. Confocal immunofluorescence images show MARCO staining. The MARCO distribution in AMϕ was analyzed by software Image J. (C) AMϕ were transfected with non-specific small interfering RNA (siNC) or small interfering RNA against MARCO (siMARCO) for 36 h. Total MARCO expression was measured by Western Blot. The graph shows the mean ± SEM of intensity of MARCO/GAPDH, n=3. Statistical analysis using independent-samples two-tailed Student’s t-test. siNC vs. siMARCO, p < 0.01. (D) AMϕ were transfected with siNC or siMARCO for 36 h, and then were treated with E. coli (MOI=4) for 60 min. The cells were stained with PE-Isotype or PE-MARCO. Cell surface MARCO on the AMϕ was determined by flow cytometry. The graph depicts mean ± SEM of MARCO MFI, n=3. Statistical analysis using two-way ANOVA, Interaction p = 0.0365. Tukey’s multiple comparisons test shows that Control/siNC vs. Control/siMARCO, p = 0.0365; E. coli/siNC vs. E. coli/siMARCO, p = 0.0005. (E) AMϕ were transfected with siNC or siMARCO for 36 h, and were then treated with Alexa Fluor 488- conjugated E. coli (MOI=4) for 60 min. The AMϕ phagocytosis of E. coli was measured by flow cytometry. The graph depicts mean ± SEM of intracellular Alexa Fluor 488-conjugated E. coli MFI, n=3. Statistical analysis using two-way ANOVA, Interaction p < 0.0001. Tukey’s multiple comparisons test shows that E. coli/siNC vs. E. coli/siMARCO, p < 0.0001. (F) AMϕ were treated with E. coli (MOI=4) for 60 min. The cells were then stained with PE-Isotype, PE-MARCO or PE-FcγRI, and cell surface MARCO or FcγRI were detected by flow cytometry. The graph depicts mean ± SEM of MFI of MARCO or FcγRI, n=3. Statistical analysis using independent-samples two-tailed Student’s t-test. MARCO/Control vs. MARCO/siMARCO, p < 0.05. (G) AMϕ were transfected with siNC or siMARCO for 36 h, and then were treated with latex beads-rabbit IgG-PE complex in 1/100 (v/v) for up to 2 hours. The intracellular latex beads-rabbit IgG-PE complex were measured by flow cytometry. The graph depicts mean ± SEM of MFI, n=3. Statistical analysis using two-way ANOVA, Interaction p = 0.8631. Tukey’s multiple comparisons test shows that 1h/siNC vs. 1h/siMARCO, p = 0.9784; 2h/siNC vs. 2h/siMARCO, p > 0.9999. The asterisks indicate that *p < 0.05 or **p < 0.01. NS, no significant difference.

