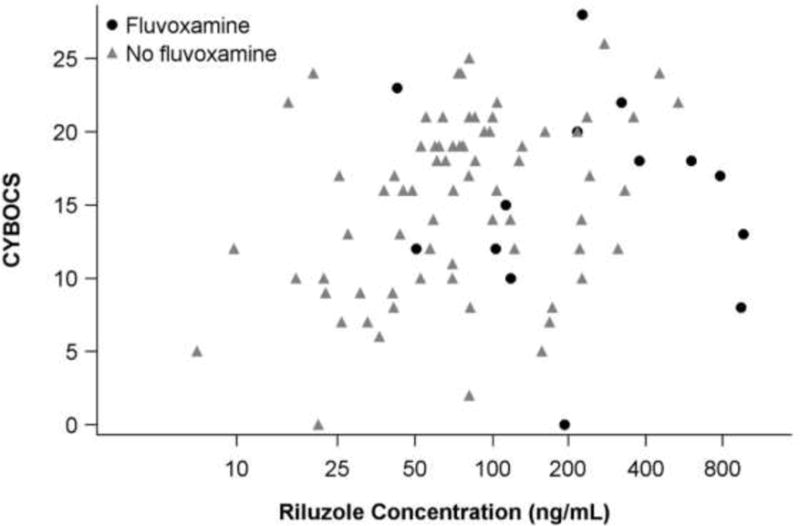
Figure 2. Symptom severity (CY-BOCS) versus riluzole concentration.

Eighty-nine samples from n=37 participants. X-axis is on the natural logarithmic scale for ease of viewing. Controlling for riluzole dose [F(1,47)=0.07, p=.80], time-of-draw [F(1,47)=0.85 p=.36] and fluvoxamine [F(1,47)=0.39, p=.54], natural log-transformed serum riluzole concentration was not associated with CY-BOCS score [F(1,47)=1.36, p=.25].
