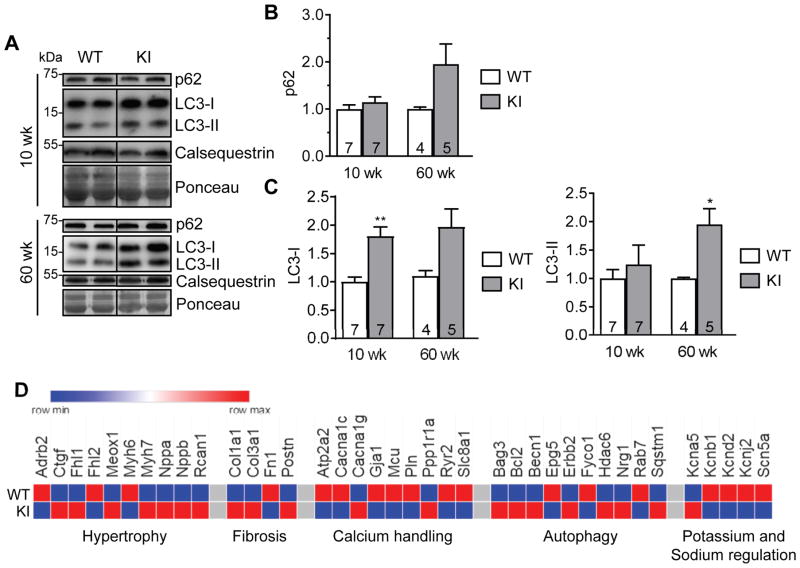
Figure 2. Dysregulation of autophagy in KI mice.
Protein levels of p62 and LC3 in 10- and 60-week-old KI and WT mouse hearts. A, Representative Western blots of indicated proteins from mouse ventricular protein extracts (membrane-enriched fraction) of indicated ages. Calsequestrin and Ponceau were used as loading controls. Quantification of B, p62 and C, LC3-I and LC3-II protein levels normalized to Ponceau and related to WT. Data are expressed as mean + s.e.m. with *P<0.05 and **P<0.01 vs. WT, unpaired Student’s t-test (Welch’s test). Number of animals is indicated in the bars. D, Heatmap of selected genes (threshold <0.8 or >1.2 fold change to WT) comparing gene expression of hypertrophy, fibrosis, calcium handling, autophagy and potassium and sodium regulation between WT and KI mice.

