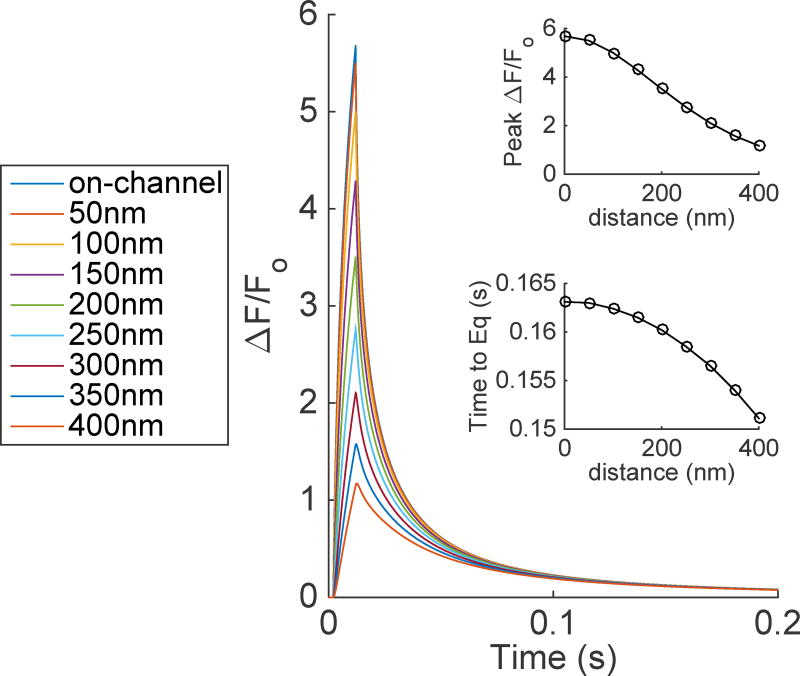
Figure 1.
Time evolution of TIRFM signals from a 10ms single Ca2+-channel opening. The distance in the positive x-direction was varied to show how ΔF/Fo is dependent upon distance from the channel. The top and bottom insets show the peak ΔF/Fo and time to equilibrate (Time to Eq.) after the channel has closed as a function of distance from the channel. Using standard conditions: DCa=223µm2/s, DCaF=15µm2/s, αf=150 µM−1s−1, and βf=450 s−1.

