
Fig. 1.
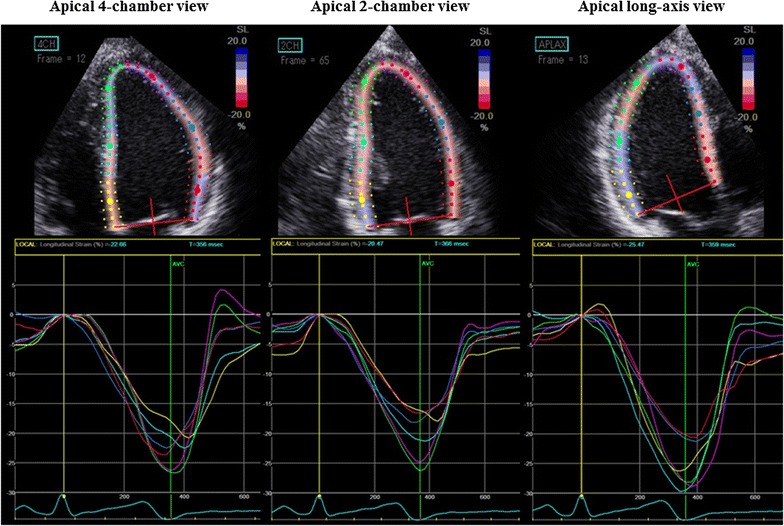
Example of a color-coded two-dimensional display of the left ventricle (LV) and corresponding time–strain curves from 18 LV sites derived from the three standard apical views for measurement of global longitudinal strain (GLS). GLS was determined as the average peak strain of 18 LV segments, and was expressed as an absolute value