
Fig. 2.
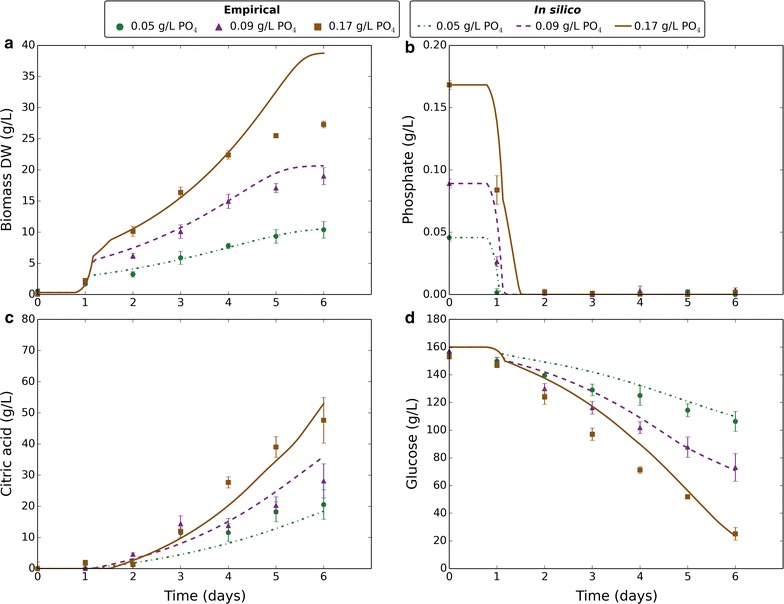
Comparing empirical and in silico data in response to varying phosphate. Markers represent empirical data and lines represent in silico data. Green circles and dashed-dotted lines correspond to 0.05 g/L phosphate. Purple triangles and dashed lines correspond to 0.09 g/L phosphate. Brown squares and solid lines correspond to 0.17 g/L phosphate. Empirical data plotted are the mean average of four biological replicates and error bars represent standard deviation. Citric acid data are normalised to reflect the amount produced. In silico data-points are one per minute. a Change in biomass dry weight (g/L) over time. b Change in external phosphate concentration (g/L) over time. c Change in external citric acid concentration (g/L) over time. d Change in external glucose concentration (g/L) over time