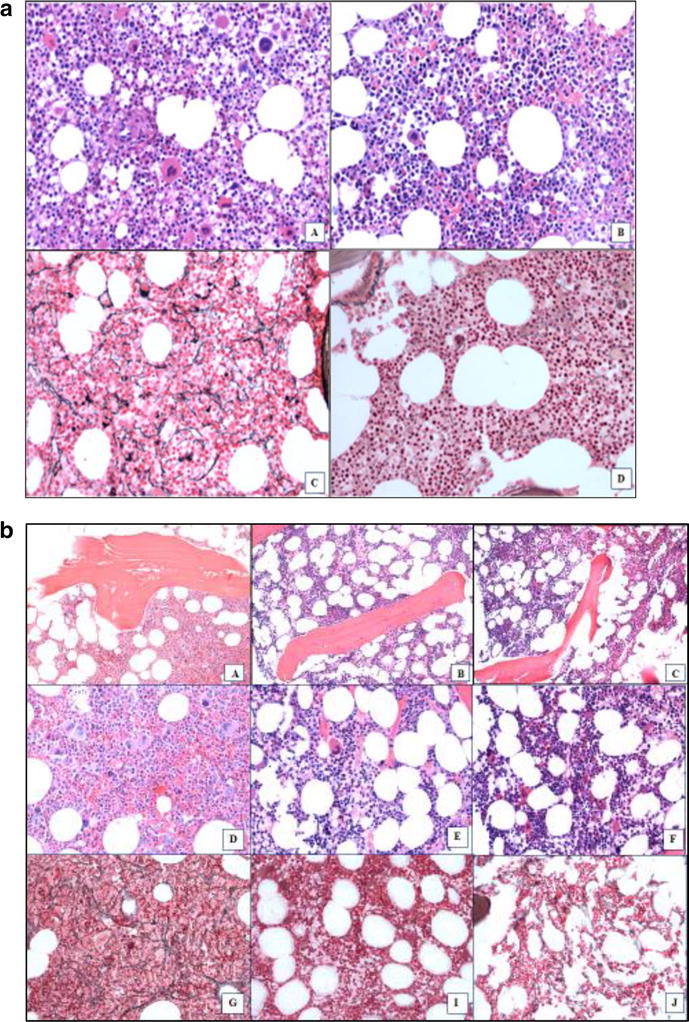
Fig. 1.

BM Response patterns observed in patients treated with PEG-INF-α-2a. a BM biopsy sections from a patient with ET who is still on therapy after 84 + months with BM-CR and CMR that was achieved after 60 months on treatment (Pt 8, Fig. 3a). A, B Hematoxylin and eosin staining at (A) the start of therapy and (B) at BM-CR after 60 months on therapy. C, D reticulin staining showing BM fibrosis at (C) the start of therapy (MF-1/2) and D at the time of BM-CR (MF-0). b Patient with PV who is still on therapy after 96 + months who achieved a CHR, CMR and BM-CR but has only sustained a CMR (Pt 4, Fig. 3b). Loss of BM-CR occurred after 84 months and loss of CHR after 96 months. Hematoxylin and eosin staining showing osteosclerosis at (A) the start of therapy, B at the time of best response (60 months), and C at relapse after 84 months. D–F Hematoxylin and eosin staining showing BM cellularity and megakaryocyte morphology at (D) the start of therapy, E at the time of best response (60 months), and F at relapse (84 months). G, I, J Reticulin staining showing BM fibrosis at (G) the start of therapy (MF-2), I at the time of best response (MF-0), and J at relapse (MF-1). All images shown are magnified ×200
