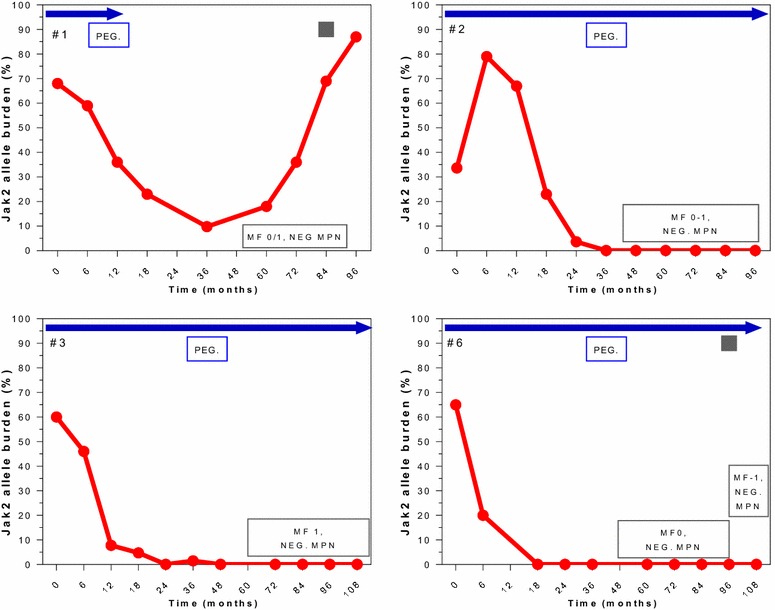
Fig. 5.

Correlation of molecular and morphological responses over time in selected patients. Patients with a sustained BM-CR with mild reticulin fibrosis (MF 0/1). The number in the top left upper corner represents the patient # from Table 2. The red line indicates the JAK2 allele burden over time. The box in the bottom right corner shows the change in BM and response, NEG MPN = no signs of ET or PV, normal BM. The gray square represents the time of loss of HR (shown only in patients who lost their HR)
