Fig. 3.

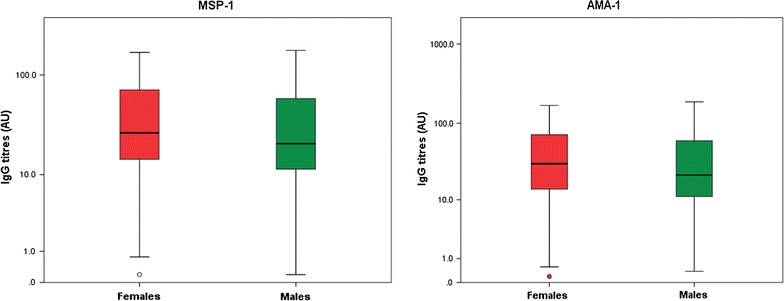
Box plot depicting the variation of mean antibody level (log-transformed) with gender. Females had a higher antibody level compared to males for AMA-1 (p = 0.010) but not for MSP-1 (p = 0.055) adjusting for age and study site

Box plot depicting the variation of mean antibody level (log-transformed) with gender. Females had a higher antibody level compared to males for AMA-1 (p = 0.010) but not for MSP-1 (p = 0.055) adjusting for age and study site