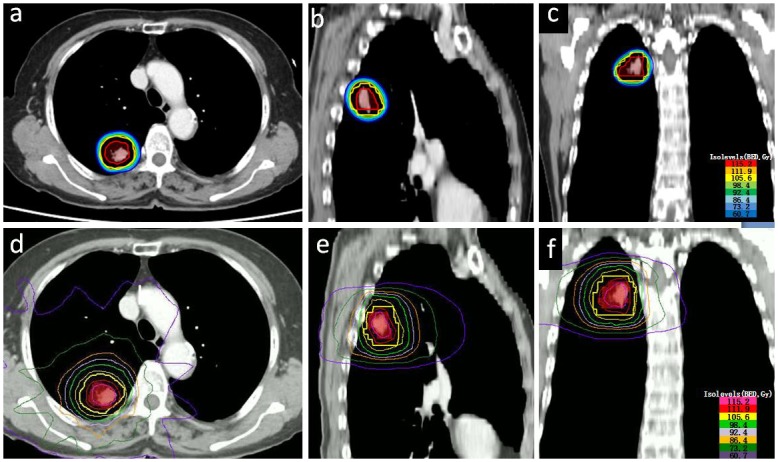
Fig 1. Representative dose distributions for the patient 5inSBT and SBRT after radiobiological conversion.

a, b and c are the axial, sagittal and coronal dose distribution in SBT respectively. The red, orange, yellow, green-yellow, green, light sky blue, dodger blue, and corn flower blue lines represent the 115.2Gy(BED), 111.9Gy(BED), 105.6Gy(BED), 98.4Gy(BED), 92.4Gy(BED), 86.4Gy(BED), 73.2Gy(BED), and 60.7Gy(BED) isodose curves respectively. d, e and fare the axial, sagittal, and coronal dose distributions in SBRT, respectively. The hot pink, crimson, yellow, green-yellow, plum, orange, leaf green, and dark violet lines represent the 126Gy(BED), 118Gy(BED), 101Gy(BED), 92Gy(BED), 81Gy(BED), 70Gy(BED), 46Gy(BED) and 23Gy(BED) isodose curves respectively.
