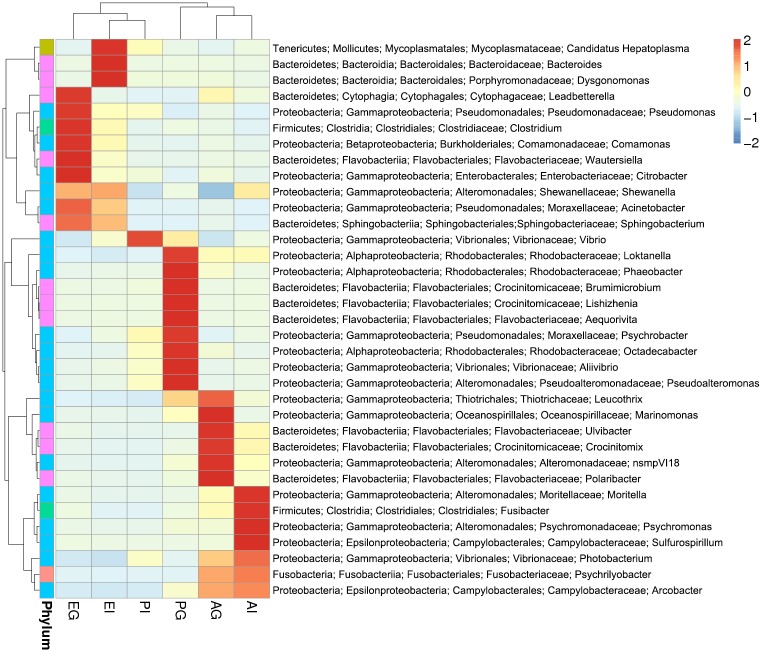
Fig 5. Heatmap of the microbial composition in the gills and intestines of the three crab species at the genus level.
The heatmap indicates the relative abundance of each genus in different samples. The Y-axis clustering exhibits the variables and phylogenetic relationships of each bacterial species in different samples and the X-axis clustering indicates the phylogenetic relationships of these samples. The color intensity in the square grid represents the bacterial relative abundance, which is named as the z-value and generated by the relative abundance of bacterial species in each line after normalization treatment.

