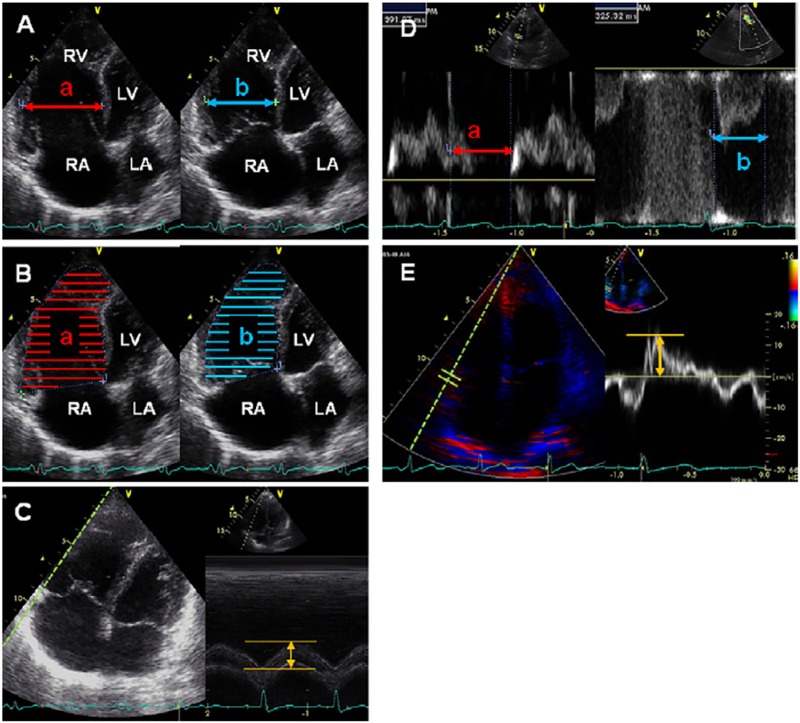
Fig 1. Representative images of echocardiographic assessment of right ventricular systolic function.
(A) %RVFS [(a–b)/a × 100%]; (B) percentage RV area change [(a–b)/a × 100%]; (C) TAPSE; (D) right ventricular MPI [(a–b)/b]; and (E) TVlat. See text for further information on how these indices were obtained or calculated. LA, left atrium; LV, left ventricle; RA, right atrium; RV, right ventricle. Reprinted from J Am Soc Echocardiogr. 2012 Mar;25(3):280–6, Takahiro Sato et al., Validation study on the accuracy of echocardiographic measurements of right ventricular systolic function in pulmonary hypertension,[7] with permission from Elsevier.

