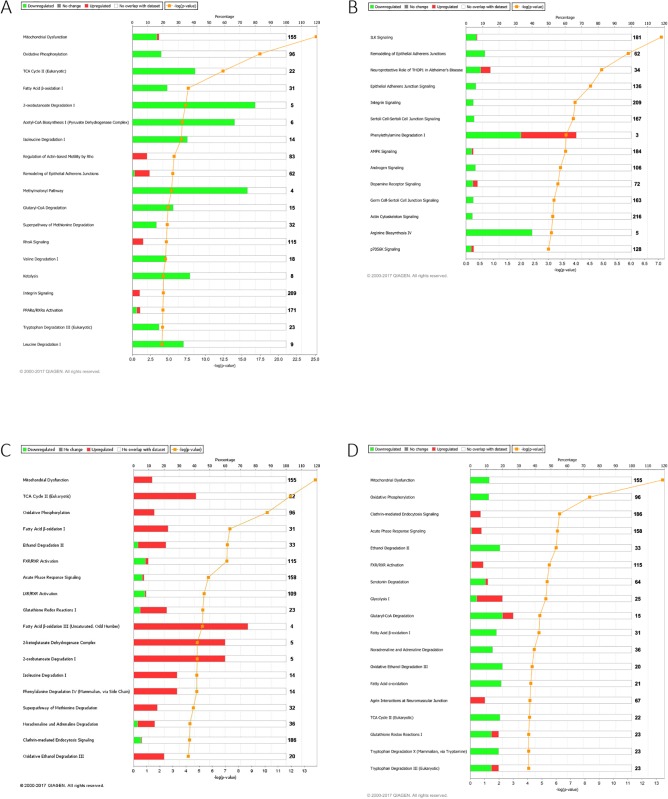
Fig 5. Canonical pathways of the comparative groups in the aorta and the kidney samples.
A: top Canonical pathways related to proteins altered in the aorta of Diabetes vs. control samples. B: Top Canonical Pathways related to proteins altered in the aorta of Insulin-treated Diabetic vs Diabetic samples C: Top Canonical Pathways related to proteins altered in the kidney of Diabetic vs. Control samples. D: Top Canonical Pathways related to proteins altered in the kidney of Insulin-treated Diabetic vs. Diabetic samples. Bars show the total number of proteins identified in each pathway. The green color represents the downregulated proteins, and the red color represents the upregulated proteins.

