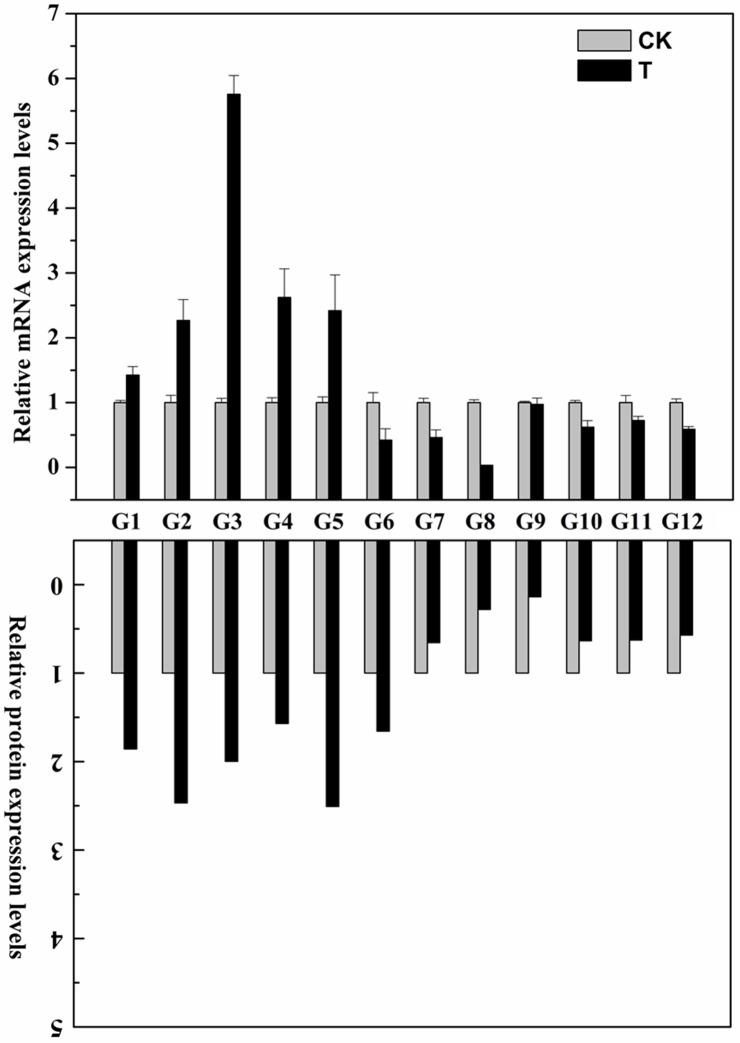
Fig 6. qRT-PCR expression analysis of selected genes with corresponding protein changes in Faba bean upon the vernalization treatment.
Faba bean seedlings were analyzed following 18 days of vernalization treatments. Relative expression levels in vernalization-treated plants were normalized against the non-treated WT plants. Bars represent SE (n = 3); The relative protein expression levels of selected proteins were derived from proteomics data of this iTRAQ-based experiment. G1: VF_4569; G2: VF_1775; G3: VF_5337; G4: Uni_12222; G5: Uni_15562; G6: VF_9725; G7: Uni_10551; G8: VF_4918; G9: Uni_13160; G10: VF_6886; G11: Uni_1350; G12: VF_6654.

