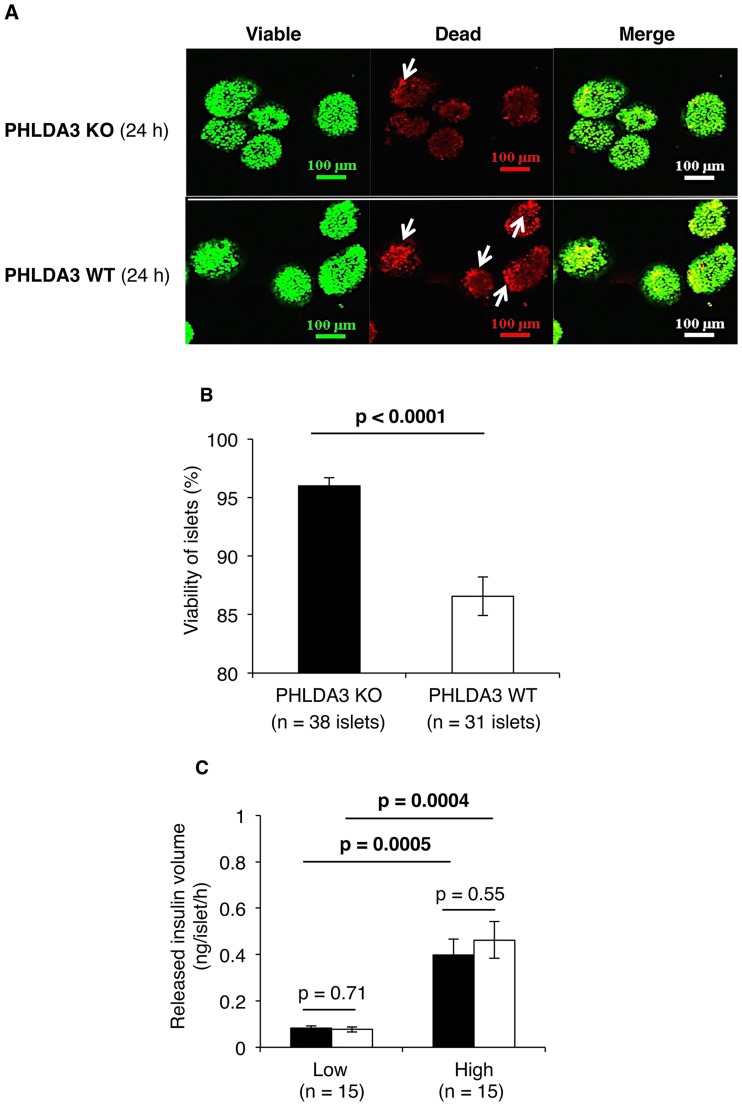
Fig 1. Condition of PHLDA3-deficient islets at 24 hs after isolation.
A. Islets from PHLDA3 KO and WT groups were stained by SYTO Green 11 (for viable cells) and ethidium bromide (for dead cells, indicated by arrow). More viable cells and fewer dead cells were seen in KO group than the WT group. The size of the scale bar is 100 μm. B. Quantification of islet viability showed significantly higher viability for PHLDA3-deficient (= KO: n = 38 islets) than wild-type islets (n = 31 islets). C. Volumes of released insulin following stimulation in low (3.3mM) and high (16.5mM) glucose solutions. Insulin release dependent on glucose concentration was seen in both the KO and WT groups, and the levels between the two groups were similar (n = 15 islets in both groups). For statistical analysis, Mann–Whitney U test was used for viability and two-way repeated measures ANOVA for insulin—releasing function.

