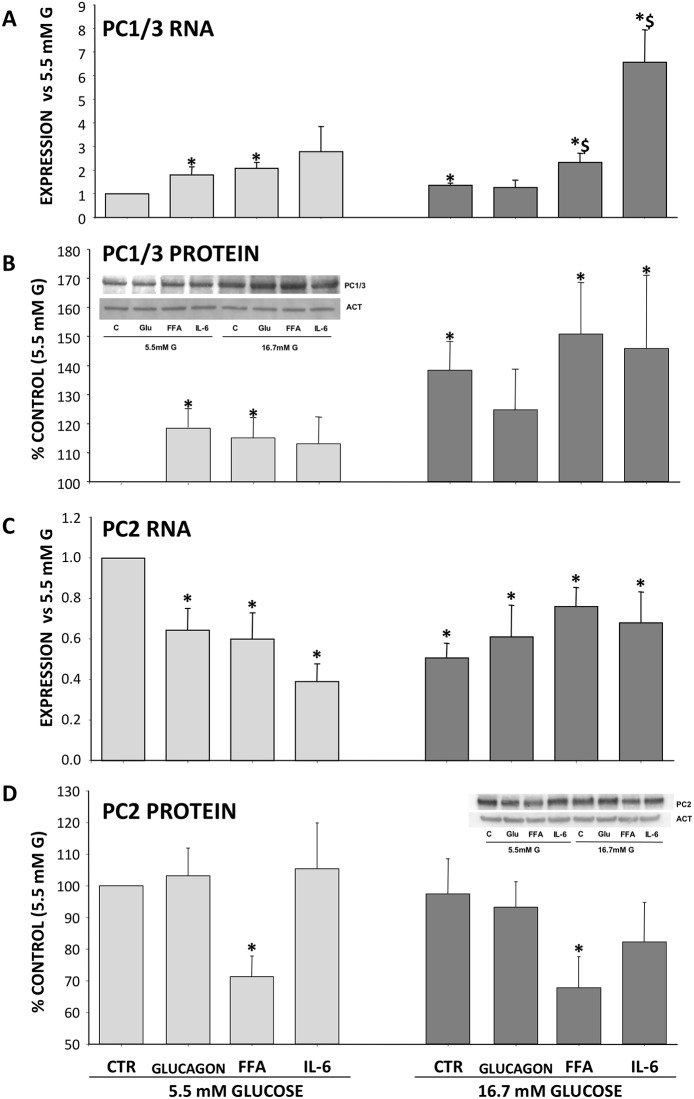
Fig 4. Effect of metabolic/hormonal pertubation on PC1/3 and PC2 expression.
Cells were incubated for 16 h in the presence of 5.5mM or 16.7mM, in the additional presence of glucagon, FFA and IL-6, total mRNA and protein were extracted and PC1/3 and PC2 expression were determined by Real Time PCR using specific primers and SDS-PAGE and Western Blotting. Panel A: PC1/3 RNA, Panel B: PC1/3 protein, Panel C: PC2 RNA and Panel D: PC2 protein. Results are Times vs control (5.5mM glucose) and % of control (5.5mM glucose) and expressed as MEAN±SEM, n = 5–7. *p<0.05 compared to control; $p<0.05 compare to control (16.7mM glucose).

