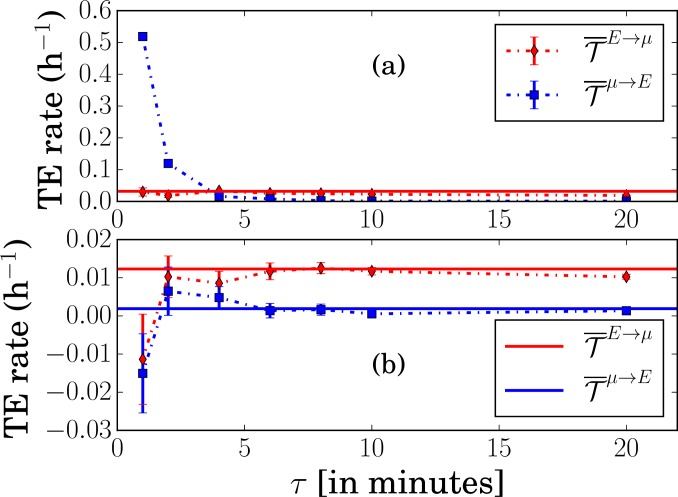
Fig 3. Transfer entropy rates and in the low IPTG experiment.
(a) Original model of Ref. [4] (b) Modified model where NE is a white noise. The symbols are the estimates from the inference method when varying the sampling time τ, and the solid lines are the theoretical predictions from Eq (13) in (a) and from Eq (60) in (b). Note that diverges as τ goes to zero in (a) but not (b).

