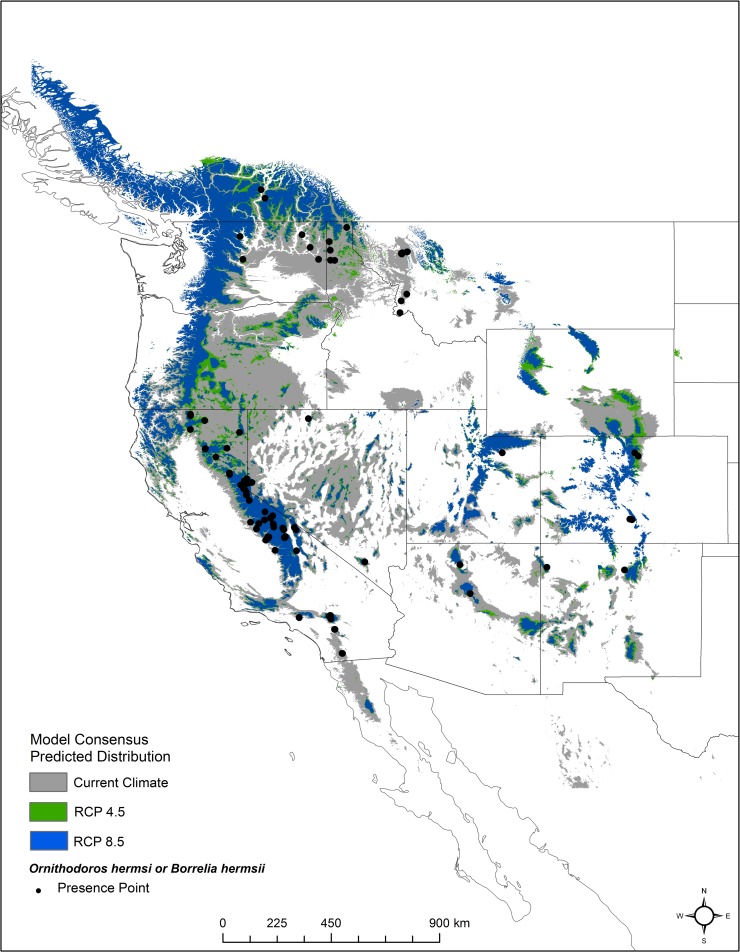
Fig 5. Comparison of current versus future distribution of Ornithodoros hermsi and Borrelia hermsii predicted by Maxent.
The map shows the current predicted distribution in comparison to the consensus of all three global climate models (GCMs)—ACCESS1-0, HadGEM2-ES, and CCSM4—under two scenarios of greenhouse gas (GHG) concentrations, RCP 4.5 and 8.5, representing medium and high estimates of GHG concentrations, respectively. Created in ArcMap (10.2, ESRI, Redlands, CA; http://desktop.arcgis.com/en/arcmap/) using environmental data from WorldClim version 1.4 (http://www.worldclim.org) [42].

