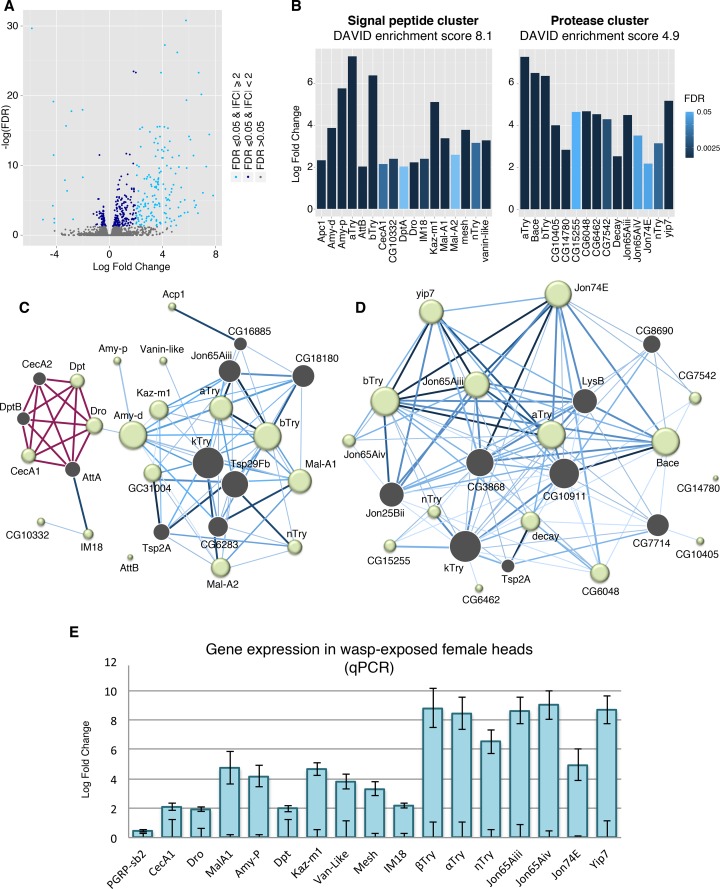
Fig 2. Signal peptide and protease genes are differentially regulated following wasp memory formation.
Volcano plot displays sequencing results from wasp-exposed fly heads. Differentially regulated genes with FDR = < 0.05 are shown in dark blue points, genes with significant FDR and a log2 fold change magnitude of 2 or more are shown in light blue (A). Signal peptide and protease gene clusters were identified as enriched from a DAVID analysis. Bar shading indicates FDR, all genes shown have FDR = < 0.05 (B). IMP network analysis was preformed for the signal peptide cluster (C) and protease cluster (D) to generate a network of interactions amongst genes. In panels C and D, each node represents a gene; a green node indicates an input gene and grey node is a predicted interacting gene within the network, size of the node reflects the number of interactions. Known interactions are shown in red, blue edges are predicted interactions—the darker the edge the higher the predicted interaction score. A subset of genes identified from the sequencing was validated with qPCR. Samples were normalized to unexposed, the lower error bars represent SE of control group, upper error bars show SE of the exposed samples (E).

