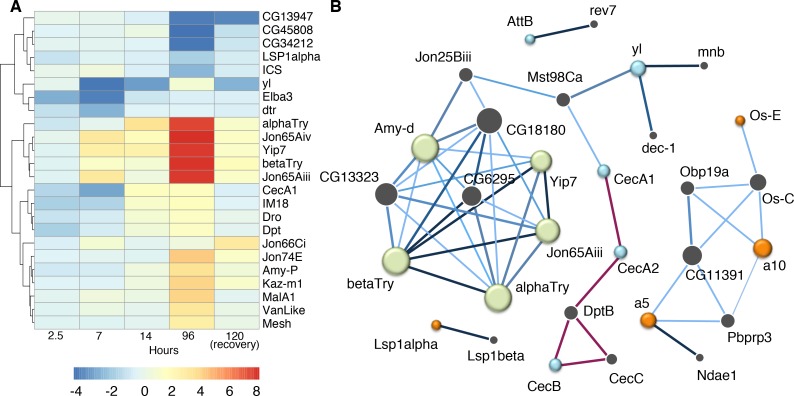
Fig 5. Temporal gene expression points to interacting networks during memory formation.
Heat map illustrates gene expression as quantified by qPCR following 2.5, 7, and 96 hours of wasp exposure. A fourth time point, 24 hours of recovery following wasp exposure, was included in the cluster analysis; shading indicates direction and magnitude of gene expression change (A). IMP network analysis was preformed for differentially regulated signal peptide genes from the 7-hour time point and a subset of genes from the 4-day signal peptide cluster (B). Each node represents a gene, a green node indicates a gene from the 4-day signal peptide cluster. Orange and blue nodes are genes from the 7-hour signal peptide cluster, color indicates that the gene is up or down regulated (orange and blue respectively). Grey nodes represent predicted interacting genes within the network, size of the node reflects the number of interactions. Known interactions are shown in red, blue edges are predicted interactions the darker the edge the higher the predicted interaction score.

