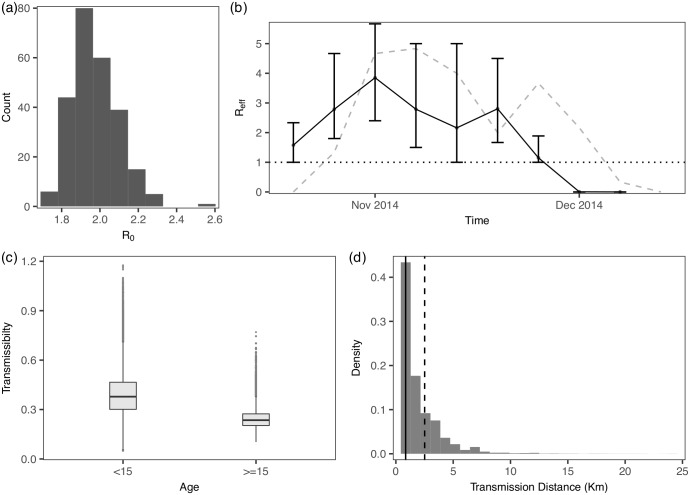
Fig 5. Model estimates for the Ebola dataset.
(a) The posterior distribution of R0. (b) The posterior distribution of Reff; median values are connected by the dots and lines, and the 95% C.I. are indicated by the bars. The observed epidemic curve, scaled by dividing by 6, is superimposed (dotted grey line). (c) The posterior distributions of age-specified β. (d) The posterior distribution of distance of transmission with median value indicated by the solid black line; the dotted line represents the median value estimated in [4].

