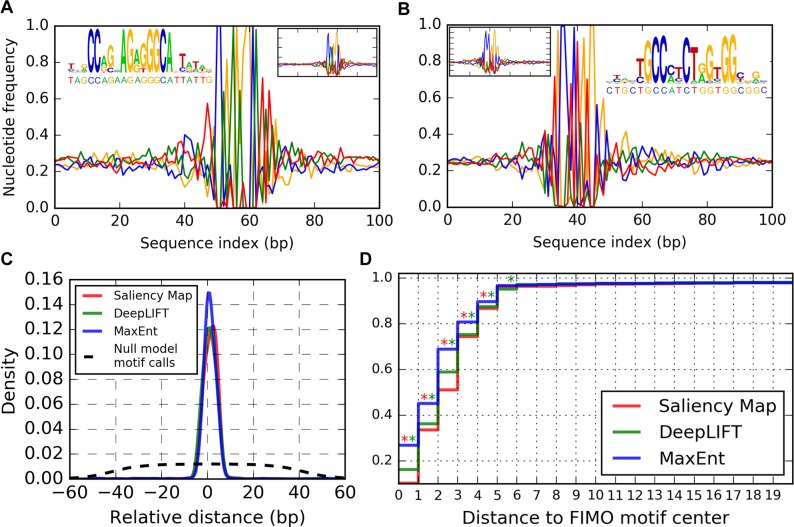
Fig 3. Interpretation of CTCF-bound sequences.
(A, B) Nucleotide frequencies of MCMC samples from MaxEnt distribution (2) for two input sequences that the ANN correctly identified as CTCF bound. Main plots correspond to sampling at β = 400; inset line plots correspond to sampling at β = 100, illustrating the multiscale nature of our interpretation method. Inset sequence logos show the called motifs, with the corresponding input sequences indicated below the horizontal axis. Colors green, blue, orange, red correspond to A, C, G, T. (C) Kernel-density smoothed distribution of relative distances between motifs called by network interpretation methods and motifs called by FIMO. Null model density is estimated by calling motif positions with uniform probability over the set of 19bp intervals contained in the 101 bp network inputs. (D) Cumulative distribution of the absolute distances from (C). Red asterisk at (x,x+1) indicates significantly fewer Saliency Map motif calls than MaxEnt motif calls within x bp from a FIMO motif (one-sided binominal test, p < 0.01)). Green asterisks indicate the similar comparison between DeepLIFT and MaxEnt motif calls.

