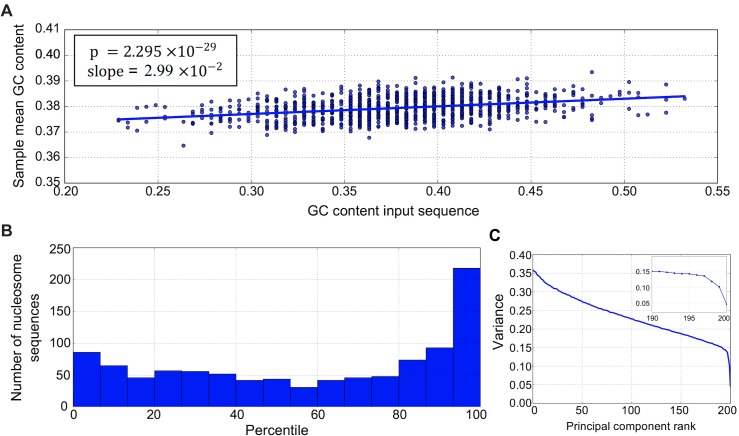
Fig 5. Assessing the importance of GC content for nucleosome positioning.
(A) Distribution of GC content of 1000 network input sequences corresponding to nucleosomal DNA and the mean GC content of samples associated with these inputs. (B) Histogram of the percentiles of GC feature importance scores in the distribution of importance scores of 300 “dummy” sequence features. Histogram summarizes percentiles of GC feature importance scores for 1000 nucleosomal sequences. (C) Example of decay in variance associated with ranked principal component vectors in PCA analysis of samples from the distribution (2).

