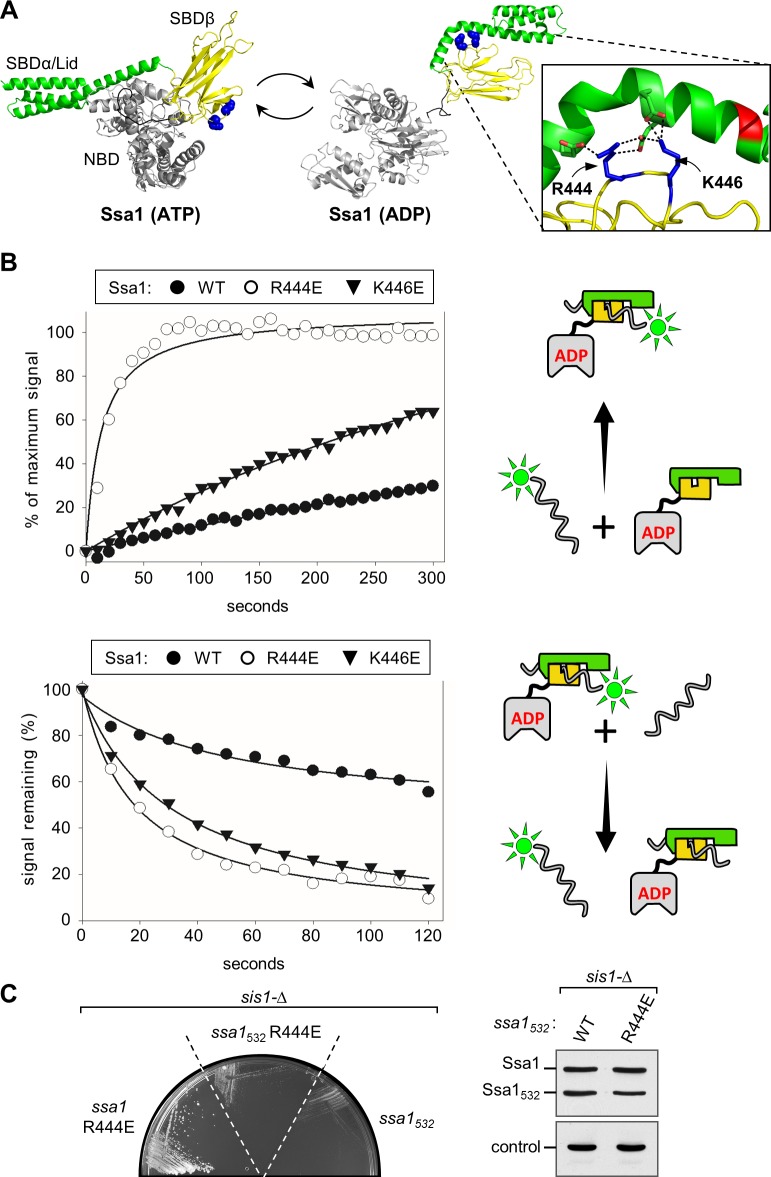
Fig 6. Interaction of Ssa1 variants with peptide substrate.
(A) Models of Ssa1 structures in the ATP- and ADP-bound states. Nucleotide binding domain (NBD), gray; α- and β-subdomains of substrate binding domain (SBD), green and yellow, respectively. Sidechains of R444 and K446 shown in sphere representation (blue). Homology modeling was performed using SWISS-MODEL; DnaK structures, PDB: 2KHO and 4JN4, used as templates for ADP and ATP states, respectively. In the zoomed-in view, the sidechains of R444, K446 (blue) and the residues with which they interact (E518/E525 and E525/D526, respectively) are shown in stick representation, with oxygen (red); interaction indicated by dotted lines. (B) Interaction of peptide substrate with WT and variant Hsp70s using fluorescin-labeled P5 peptide, measured by fluorescence anisotropy. Cartoons at right depict reactions: Hsp70 domains: NBD, gray; SBDβ, yellow; SBDα, green. Peptide, wavy line; fluorescein label, neon green. (Top) Kinetics of Ssa1/F-P5 complex formation. Left, at t = 0, 10 nM fluorescein labeled P5 (F-P5) and 5 μM Ssa1 WT or variants were combined in the presence of 1 mM ADP. Fluorescence polarization data were collected over time and plotted as a percent of binding observed at equilibrium in assays in which incubation was extended overnight. Each data point represents the mean of three experiments. (Bottom) Kinetics of peptide dissociation. F-P5 and Ssa1 were combined to yield reaction compositions identical to those described in (B) and incubated until equilibrium was reached. At t = 0, excess P5 was added and fluorescence polarization monitored over time. Values are plotted as a percent of the initial signal remaining. Each data point represents the mean of three experiments. Right, schematic of assay. (C) (left) Growth of sis1-Δ cells harboring a plasmid with a WT SIS1 gene and URA3 marker plus the indicated TRP1-marked plasmids encoding full-length Ssa1 or Ssa1 lid-truncated variants containing N-terminal 1–532 residues (Ssa11-532) with or without an additional R444E substitution. Site of the SBDα truncation indicated in red in (A). (right) Cell lysates of starting strains expressing WT Ssa1 and truncated ssa11-532 variants were subjected to immunoblot analysis using antibodies raised against Ssa1 or, as a control, Tim44.

