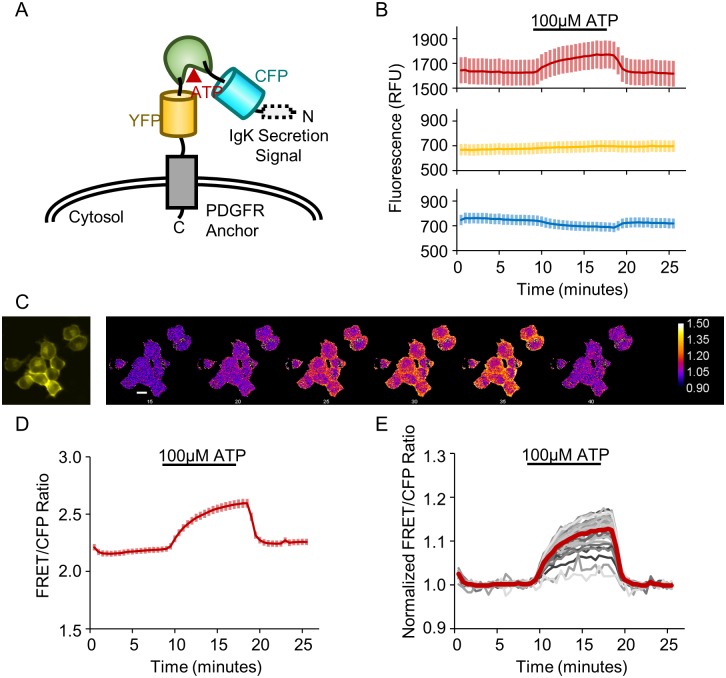
Fig 1. The ecATeam3.10 sensor detects extracellular ATP.
(A) Schematic of ecAT3.10 design in which the ATeam3.10 FRET-based ATP sensor is displayed on the cell surface via a PDGFR transmembrane anchor. (B) Fluorescence intensity in the FRET channel increases upon wash-in of 100 μM ATP while the CFP donor intensity decreases. As expected, the YFP direct acceptor channel does not show an ATP-dependent change. Cells were imaged under continuous perfusion. (C) Representative widefield fluorescence images for the cells analyzed in (D-E). The first panel in the YFP channel shows morphology, the subsequent panels are false colored to show the change in the normalized FRET/CFP pixel-by-pixel ratio signal. Scale bar is 20μm. (D) The average FRET/CFP emission ratio, which we refer to as the ratio signal, shows a robust increase of 0.27 ± 0.01 (n = 41 cells). Values and solid line traces are cell means, and errors and error bars are standard errors of the means. (E) To account for drift, a linear baseline was fitted, and the ratio signal was normalized on a cell-by-cell basis (individual cells, gray), showing an average fold change of 1.127 ± 0.005 (population average, red).

