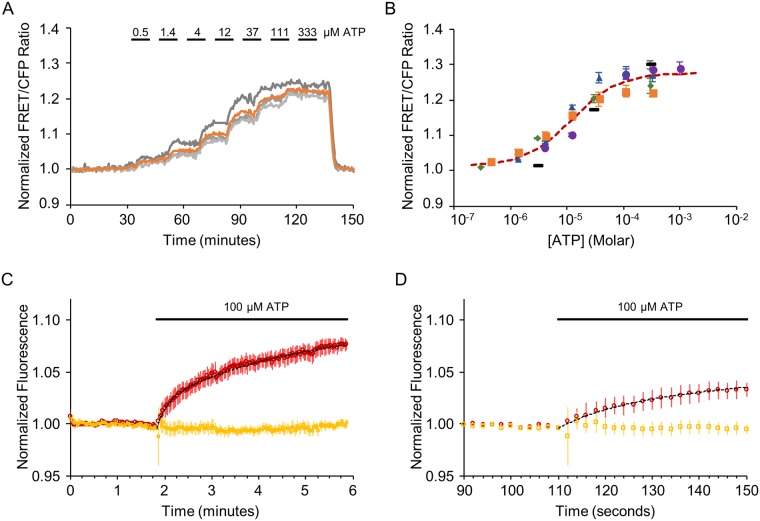
Fig 3. Characterization of ATP affinity and response kinetics.
ecATeam3.10 exhibits a concentration-dependent change in FRET/CFP ratio signal. Live Neuro2A cells expressing ecAT3.10 were imaged at room temperature under continuous perfusion, during which increasing concentrations of extracellular ATP were washed in a stepwise fashion. (A) A representative time course from one experiment with four cells. Each grey trace represents the response from an individual cell in which the regions of interest were drawn around the membrane. The orange trace is the mean response. (B) Summary of ATP dose-response data from five independent experiments, each represented its own symbols. The orange squares represent data from (A), and the dashed red curve is fit to the mean of all experiments. In four of the five experiments, sufficient data was available for independent fitting to a Hill equation (mean ± sem, n = 4 experiments: K = 12 ± 5 μM, Ratiomax/Ratiomin = 1.23 ± 0.01, n = 1.4 ± 0.2). A global fit of data from all five experiments was also performed for comparison. (fitting mean ± sem, n = 5 experiments: K = 11 ± 2 μM, Ratiomax/Ratiomin = 1.28 ± 0.01, n = 0.9 ± 0.1). (C-D) ecAT3.10 responds to an increase in extracellular ATP within seconds. (C) Cells were imaged during fast perfusion wash in of 100 μM ATP, and the sensor exhibited an increase in FRET within seconds (n = 27 cells, 3 experiments; two-exponential fit: τfast = 13 ± 1 sec, τslow = 172 ± 18 sec). (D) An expanded view of the initial response shown in (C). Red, FRET fluorescence channel intensity. Yellow, YFP fluorescence channel intensity. Dotted black curve, two-exponential fit.

