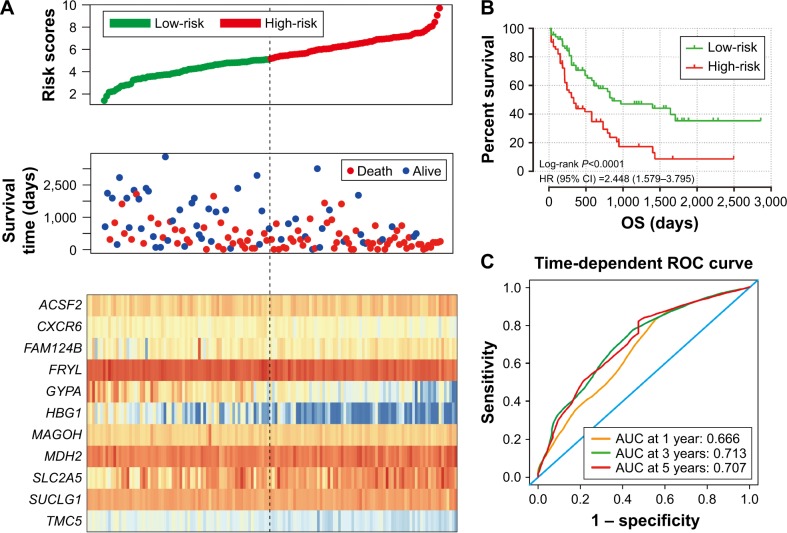
Figure 7.
Prognostic gene signature of the 11 genes in AML patients of the TCGA-LAML cohort.
Notes: (A) From top to bottom is the risk score, patients’ survival status distribution, and expression heat map of the 11 genes for low- and high-risk groups. (B) Kaplan–Meier curves for low- and high-risk groups. (C) ROC curve for predicting OS in AML patients by the risk score.
Abbreviations: AML, acute myeloid leukemia; AUC, area under the ROC curve; CI, confidence interval; OS, overall survival; ROC, receiver operating characteristic; TCGA-LAML, The Cancer Genome Atlas AML project.

