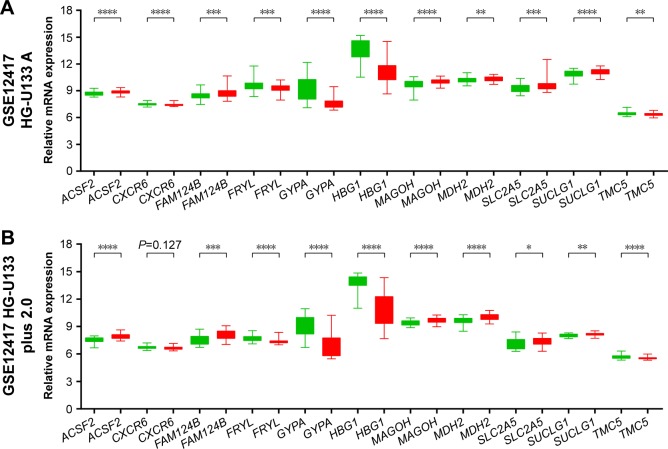
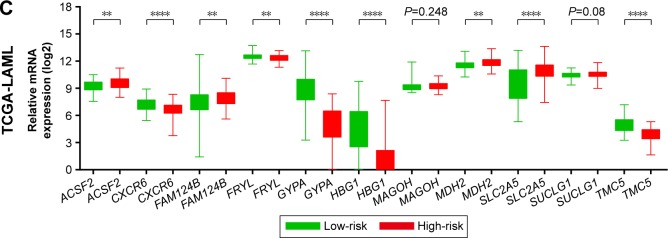
Figure 8.
The expression level distribution of the 11 genes in the low- and high-risk groups.
Notes: The difference in the expression level of the 11 genes between the low-risk group and high-risk group of the GSE12417 HG-U133A (A), GSE12417 HG-U133 plus 2.0 (B), and TCGA-LAML (C) cohorts. *P<0.05, **P<0.01, ***P<0.001, ****P<0.0001.
Abbreviation: TCGA-LAML, The Cancer Genome Atlas AML project.


