
Figure 1. Diversity, Similarity and Networks of Large Clones.
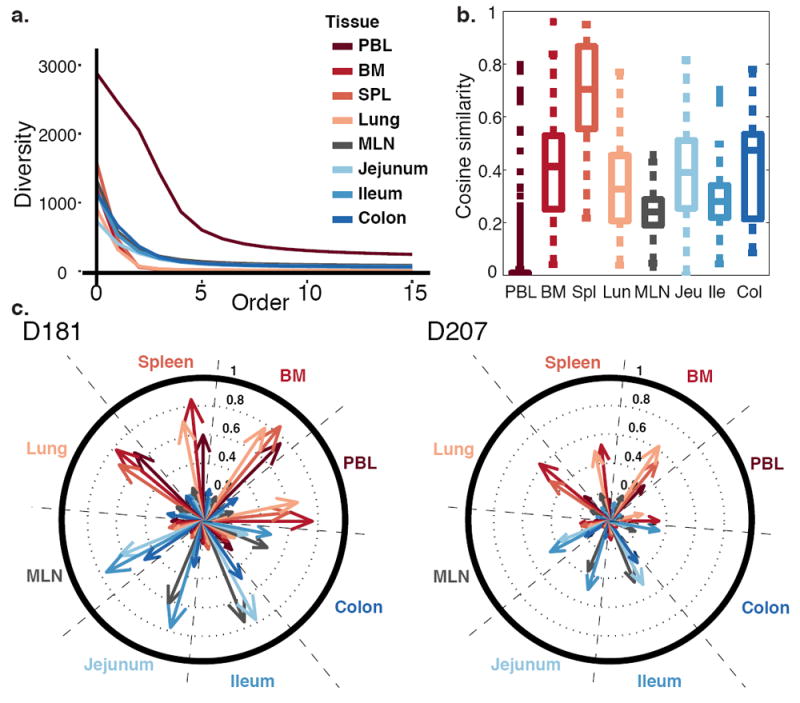
(a) Peripheral blood clones exhibit the highest sampled diversity. Diversity of clones with at least 20 unique sequence instances (C20 clones) is plotted at different orders (Hill numbers) in different tissues in D207. At an order of 0, the diversity is the number of different clones. At orders >1, diversity is influenced more by the most abundant clones. (b) Tissues exhibit higher internal similarity than blood. Box plots represent the distribution of cosine similarity between all pairs of sequencing libraries within a tissue (see Methods). Similarity is assessed for C20 clones in D207. Boxes represent the first and third quartiles bisected by the median. Whiskers represent the most extreme data excluding outliers, where outliers (dots) are data beyond the third or first quartile by a distance exceeding 1.5 times the inter-quartile interval. Higher cosine values correspond to greater sharing of large clones between replicate libraries from the same tissue. (c) Large clones form two major networks– one in blood-rich compartments (red tones) and one in the GI tract (blue tones). Shown are the cosine similarities of C20 clones between tissue pairs in D181 and D207. Each wedge within the circle represents a tissue. Each arrow represents the level of overlap (cosine similarity) in clones from other tissues to the clones in that wedge. Longer arrows indicate more overlap between the tissues. PBL = peripheral blood; BM = bone marrow; SPL = spleen; MLN = mesenteric lymph node.