
Figure 2. Tissue Distributions of Large Clones.
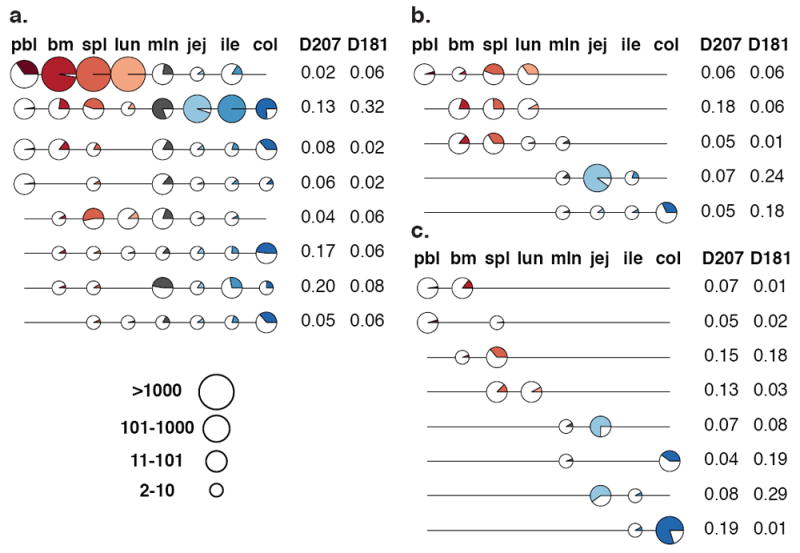
(a) Global (found in 6-8 tissues); (b) Regional (3-5 tissues) and (c) Two-Tissue C20 Clones. Each line is a clone. Each circle denotes membership of the clone in a particular tissue. The size of circle represents the total number of sequence instances the clones have in each tissue (depicted in legend). The portion of the circle that is colored represents the fraction of sequencing libraries from that tissue that contain at least one sequence of the clone (with at least two copies). The frequencies of each distribution type are indicated to the right of each clone line. Only the most frequent tissue distribution types (those that are present in at least 5% of a given tissue category in at least one of the two donors—D181 or D207) are shown. Tissues are colored as in Fig 1. lun = lung; jej = jejunum; col = colon; other abbreviations are as in Fig. 1.