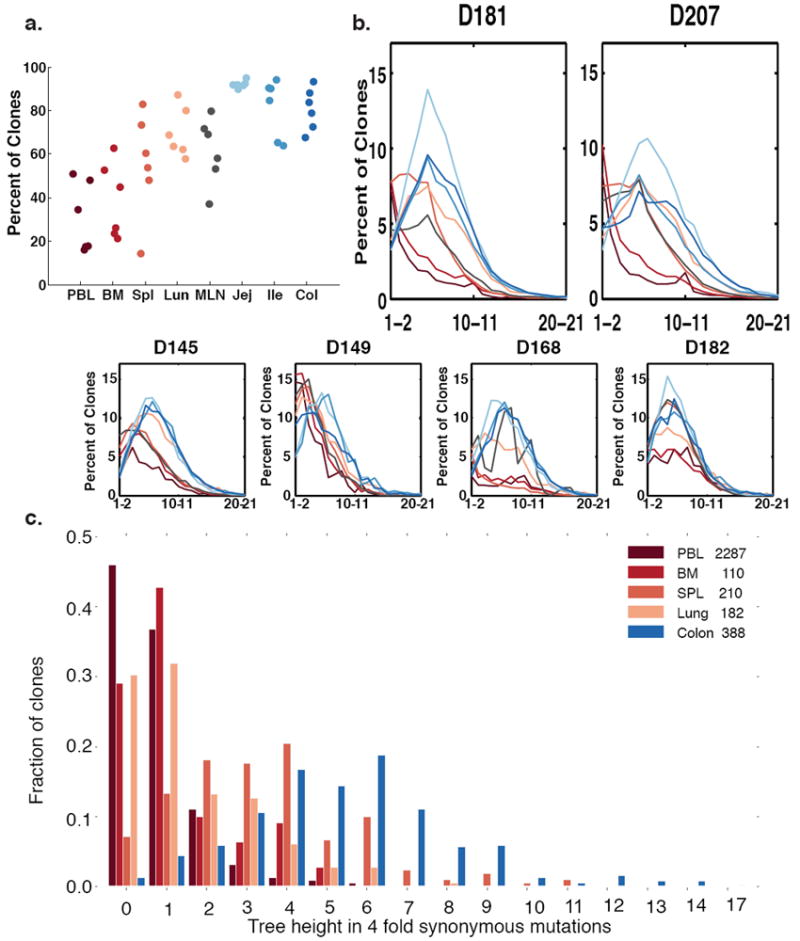
Figure 4. Somatic Hypermutation in Different Tissues.

(a) Clones are more mutated in the tissues. Shown are percentages of clones that have average mutation frequencies of 1% or more. In all clones, only sequences from a specific tissue are counted (see Methods). Each column represents a separate tissue. Each dot represents an individual donor. (b) GI tract clones have right-shifted mutation frequency distributions compared to blood tissue clones in most donors. The average number of mutations per clone is plotted versus the percent of clones with that mutation level. Each line denotes a separate tissue. Segregation of mutations per clone to different tissues was accomplished as in Fig. 4a (see Methods). (c) Lineage tree heights of C20 single-tissue clones in different tissues of D207. Only tissues with >100 single tissue clones are shown. The tree height is defined as the maximum distance of a sequence in the clone from the germline when considering only 4-fold redundant synonymous mutations (see Methods).
