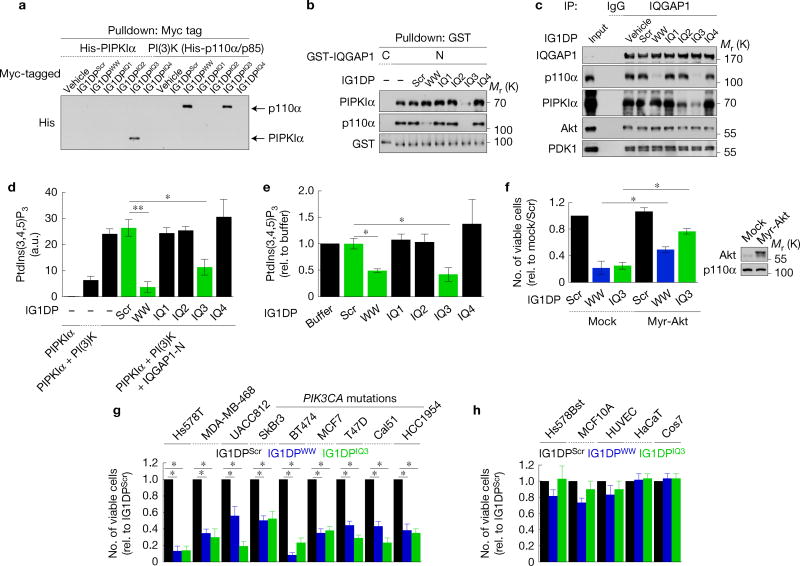
Figure 6.
IG1DPs inhibit cancer cell survival by blocking PtdIns(3,4,5)P3 synthesis. (a) In vitro binding assays of IG1DPs with PIPKIα or PI(3)K. (b,c) Effects of IG1DPs on IQGAP1 interactions with PIPKIα and PI(3)K were analysed by in vitro binding assay (b) or immunoprecipitation in Hs578T cells (c). (d,e) Effects of IG1DPs on PtdIns(3,4,5)P3 synthesis were analysed in vitro (d) or in Hs578T cells (e) of n = 3 independent experiments. P = 0.005, 0.042 (c), 0.011, 0.036 (e). (f) Viability of MDA-MB-231 cells transfected with a constitutively active Akt1 after 30µM IG1DP treatment, mean ± s.d. of n=3 independent experiments. P=0.013, 0.02. (g,h) Cell viability was measured after treating with 20µM IG1DPs in the indicated cells for 48 h, except 30 µM for T47D and Cal51 cells, mean ± s.d. of n = 3 independent experiments. P = 0.012, 0.015 (Hs578T), 0.024, 0.022 (MDA-MB-468), 0.034, 0.020 (UACC812), 0.027, 0.026 (SkBr3), 0.010, 0.015 (BT474), 0.020, 0.020 (MCF-7), 0.034, 0.028 (T47D), 0.033, 0.020 (Cal51), 0.022, 0.020 (HCC1954). Paired Student’s t-tests were used for statistical analysis (*, P < 0.05; **, P < 0.01; NS, not significant). Source data for c,e–h can be found in Supplementary Table 1. Unprocessed original scans of blots are shown in Supplementary Fig. 7.

