


Fig. 1.
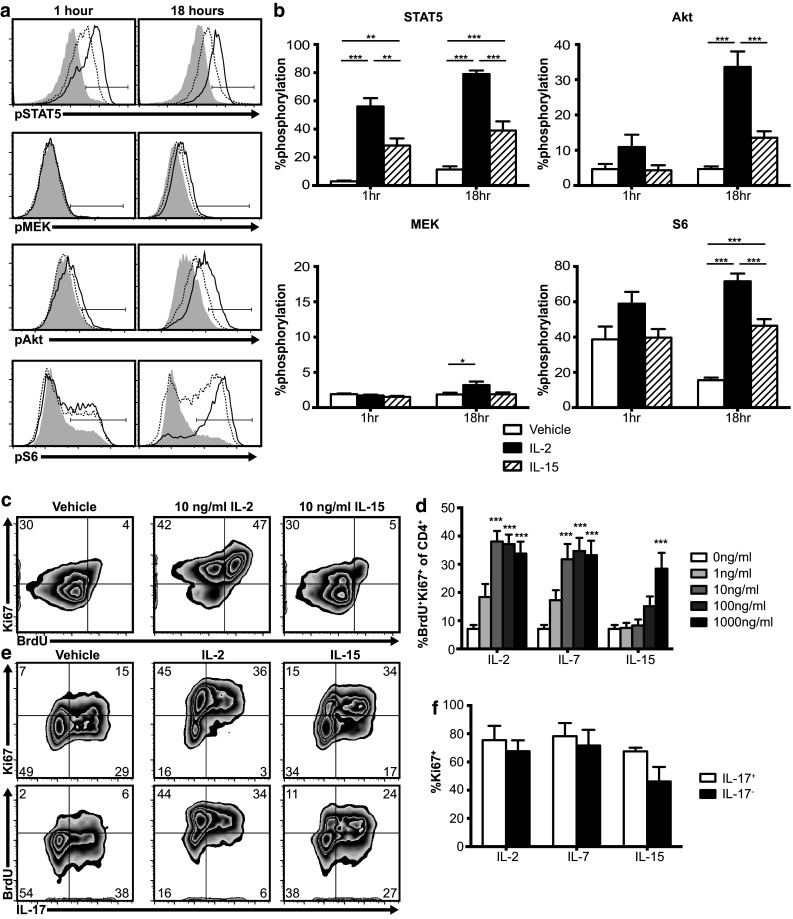
Th17 cells respond to IL2Rγ-chain cytokines in vitro. a, b TRP-1 Th17 cells phosphorylate STAT5, MEK, Akt, and S6 following IL-2 (100 ng/ml, solid lines) or IL-15 (100 ng/ml, dotted lines) stimulation (gray histograms = no cytokine). Graphs show mean plus standard error of eight independent experiments, *p < .05, ** p < .01, *** p < .001 by one-way ANOVA with Tukey’s multiple comparison test. c, d TRP-1 Th17 proliferate following 2 day stimulation with IL-2, IL-7, or IL-15 (100 ng/ml) in vitro. Graph shows mean plus standard error of seven independent experiments, *p < .05, ** p < .01, *** p < .001 for the indicated dose vs vehicle by one-way ANOVA using Dunnett’s multiple comparison correction. e, f IL-17+ and IL-17− populations of Th17 polarized TRP-1 cells proliferate similarly in response to IL-2, IL-7, or IL-15 (100 ng/ml). Graph shows mean plus standard error of three independent experiments, IL17+ vs IL17− p > .05 for all cytokines by two-tailed t test