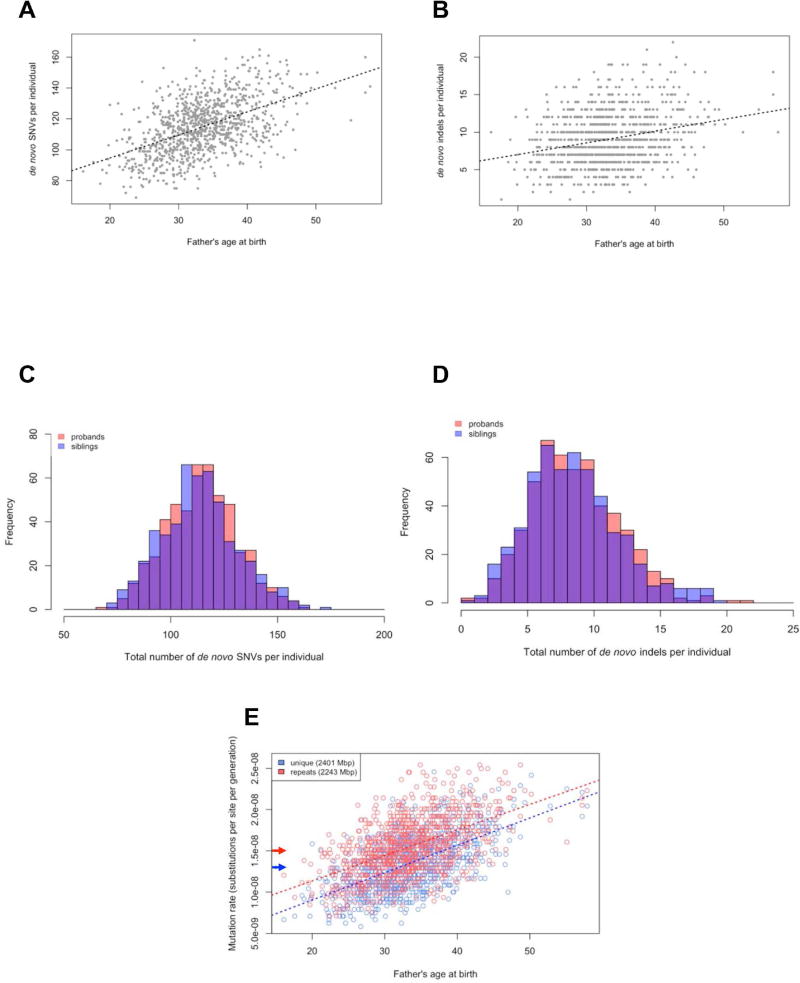
Figure 1. Patterns of DNM.
(A) There was a strong correlation between the number of de novo SNVs and paternal age (SNV Pearson’s r=0.50, p=1.17×10−64) with an estimated increase of 1.49 [1.32, 1.65] SNVs for each additional year of father’s age. (B) There was a strong correlation between the number of de novo indels and paternal age (indel Pearson’s r=0.27, p=1.75×10⁻¹⁷) with an increase of 0.16 [0.12, 0.19] indels for each additional year of father’s age. (C) Histogram of de novo SNVs per individual (red=proband, blue=sibling). (D) Histogram of de novo indels per individual (red=proband, blue=sibling). (E) Mutation rate estimates comparing unique and ancient repeat portions of the genome. The overall mutation rate based on experimental validation was 1.7×10⁻⁸ substitutions per site per generation with a mutation rate of 1.3×10⁻⁸ in unique regions (blue arrow) and 1.5×10⁻⁸ in ancient repetitive DNA (red arrow). VRs were comparable between unique regions (97.6%, n=1,640) and ancient repetitive DNA (95.8%, n=216). The average paternal age was 33.4 ± 5.9 years for the 1,032 genomes analyzed here.

