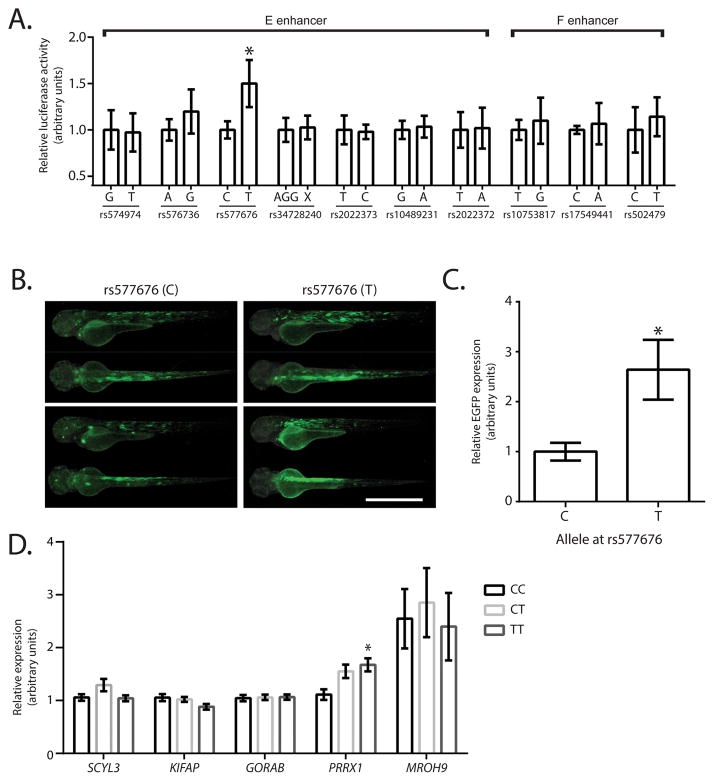
Figure 3. Identification of the functional SNP at PRRX1 locus for AF.
A. Identification of the functional SNP at E and F enhancer regions. Luciferase assay results (n=6) showing the alteration of the enhancer activity depending on the SNP allele within E and F enhancer regions from major to minor allele. Regions ranging 100–300bp in length containing a single SNP are labeled as SNP number. *Represents p<0.05 as compared to the major allele. B. Representative fluorescent micrographs of 72 hours post fertilization zebrafish displaying the tissue distribution and intensity of the enhancer of the 237bp region containing different alleles of rs577676. Scale bar represents 1mm. C. qRT-PCR results showing relative eGFP expression levels in zebrafish injected with a construct containing rs577676(C) or rs577676(T) (n=11). * Represents p<0.05 as compared to the major (risk) allele. D. Expression quantitative trait loci analysis showing the comparison of PRRX1 mRNA levels depending on the genotype at rs577676 (n(CC)=28,n(CT)=66, n(TT)=27). *Represents p<0.05 when compared to homozygous C (risk) allele.

