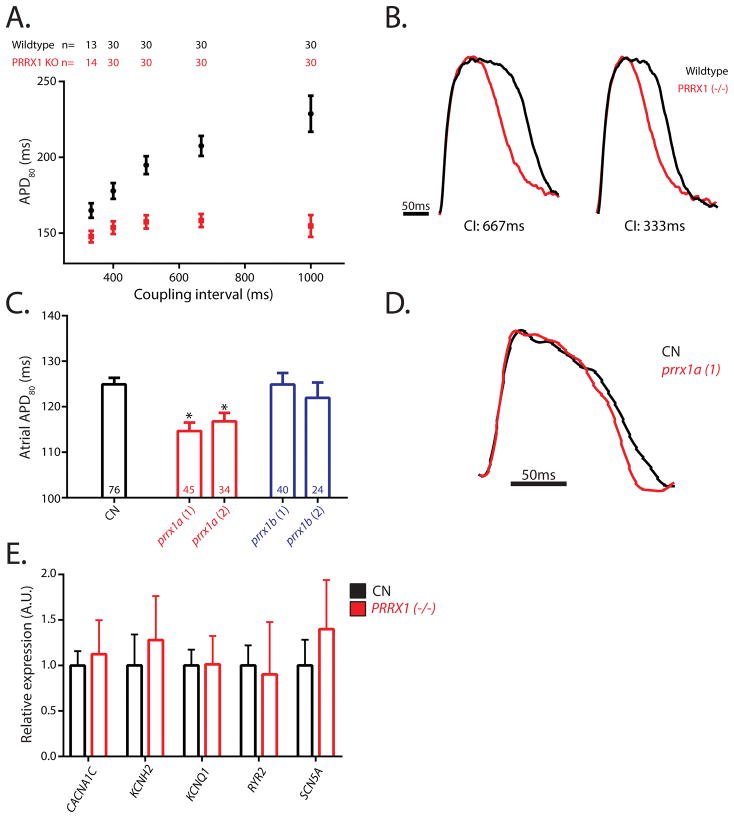
Figure 4. The effect of PRRX1 suppression on the action potential in ES-derived cardiomyocytes and zebrafish.
A. Action potential duration at 80% repolarization (APD80) assayed by Arclight fluorescence in field-paced ES-derived cardiomyocytes. n’s for each respective measurement are displayed above in the corresponding color text. B. Representative traces of ES-derived cardiomyocyte action potentials for wild-type and PRRX1 knockout cells. CI represents the coupling interval between stimulations. C. APD80 as assayed by optical mapping with 2hz field pacing in 72 hours post fertilization zebrafish hearts. prrx1a(1) and prrx1a(2) represent the two distinct prrx1a targeting morpholinos used to ensure the specificity of the effects observed. Numbers of replicates are displayed within the bars. D. Representative traces of atrial action potentials for prrx1a(1) and control morpholino injected zebrafish hearts. *Represents p<0.05 when compared to control. CN-control. Error bars in all panels represent the SEM. E. Relative expression by qRT-PCR of major ion channels in control and PRRX1 (−/−) stem cell derived cardiomyocytes. Error bars represent the SEM derived from 4 control and 3 PRRX1 (−/−) biological replicates.

