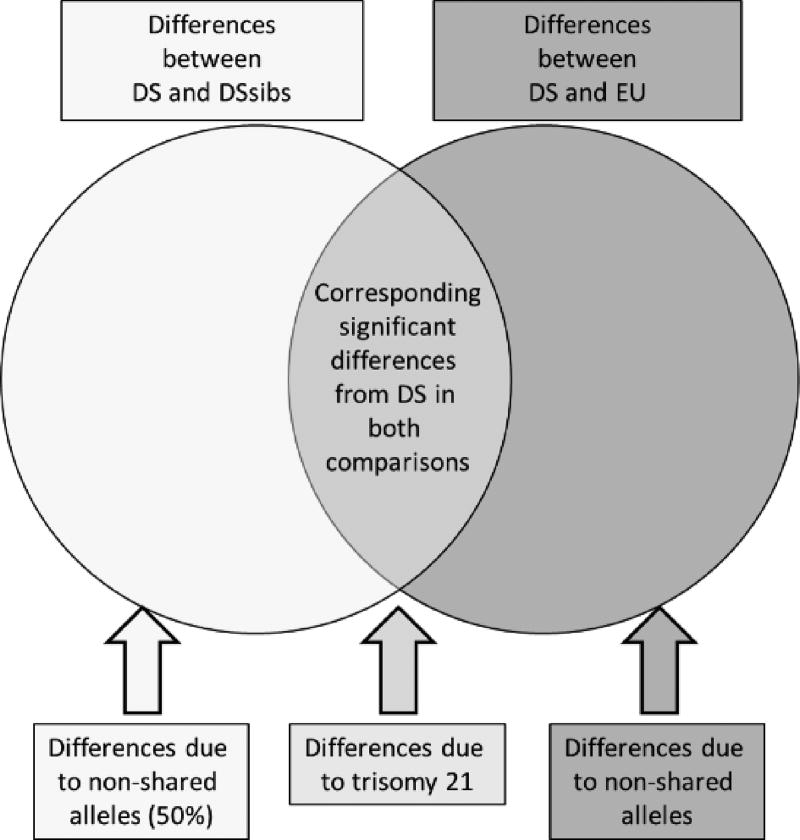
Figure. 1.
Diagram of how morphological differences are attributed to the effects of trisomy 21 and genetic relatedness (or lack thereof) among the Down syndrome (DS), Down syndrome sibling (DSsib), and unrelated euploid (EU) samples. A diagram of differences from two sample comparisons of the DS sample compared to DSsibs (left) and DS compared to EU (right) are shown. The DS sample is common to each two-sample analysis. Significant measurements are divided into those that overlap among two-sample comparisons and those that do not. Homologous significant measurements from each two-sample comparison that included the DS sample are attributed to the effects of trisomy 21 on facial morphology. These corresponding differences were subtracted to remove the effects of DS on facial morphology and to explore morphological similarity between DSsibs, who share approximately 50% of alleles, and unrelated EU individuals. Color figure can be viewed in the online issue, which is available at http://onlinelibrary.wiley.com/journal/10.1002/(ISSN)1552-4833.

