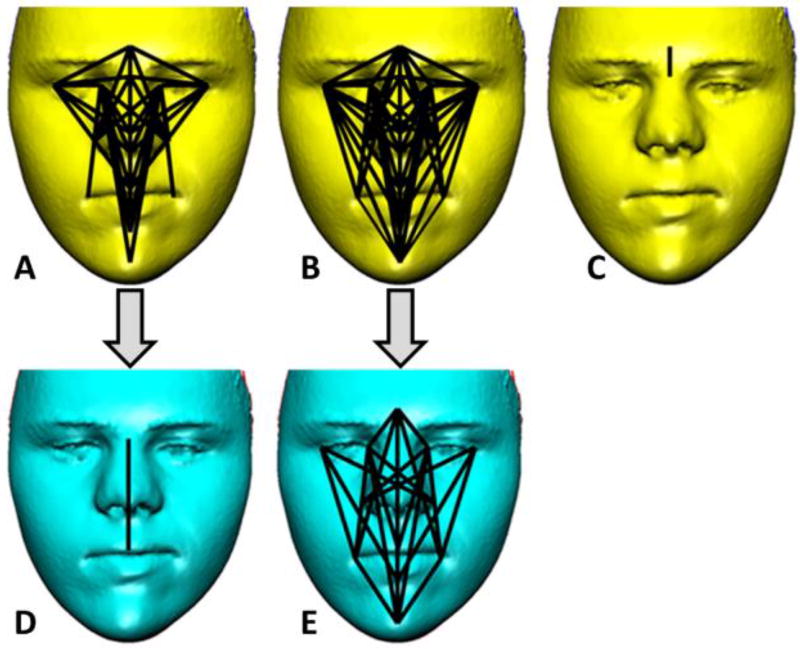
Figure. 2.
Facial form differences between Down syndrome (DS), DS sibling (DSsib), and unrelated euploid (EU) samples. A) Linear distances (LDs) that significantly differ between the DS and DSsib samples (69/190 or 36%). The LDs are all 7–19% smaller in the DS sample relative to the DSsib sample. B) The LDs that significantly differ between the DS sample and the EU sample (88/190 or 46%) are shown. All LDs are 6–18% smaller in the DS sample relative to the EU sample. C) The LD that differs significantly between the DSsib sample and the EU sample (1/190 or <1%) are shown. D) For the DS and DSsib comparison one significant LD remains after subtracting 68 LDs that were common to A and B and attributed to the effects of trisomy 21 (see Fig. 3). E) For the DS and EU comparison 20 significant LDs remain after subtracting 68 LDs that were common to A and B and attributed to the effects of trisomy 21. Facial images shown have been modified to remove identifiable features. Color figure can be viewed in the online issue, which is available at http://onlinelibrary.wiley.com/journal/10.1002/(ISSN)1552-4833.

