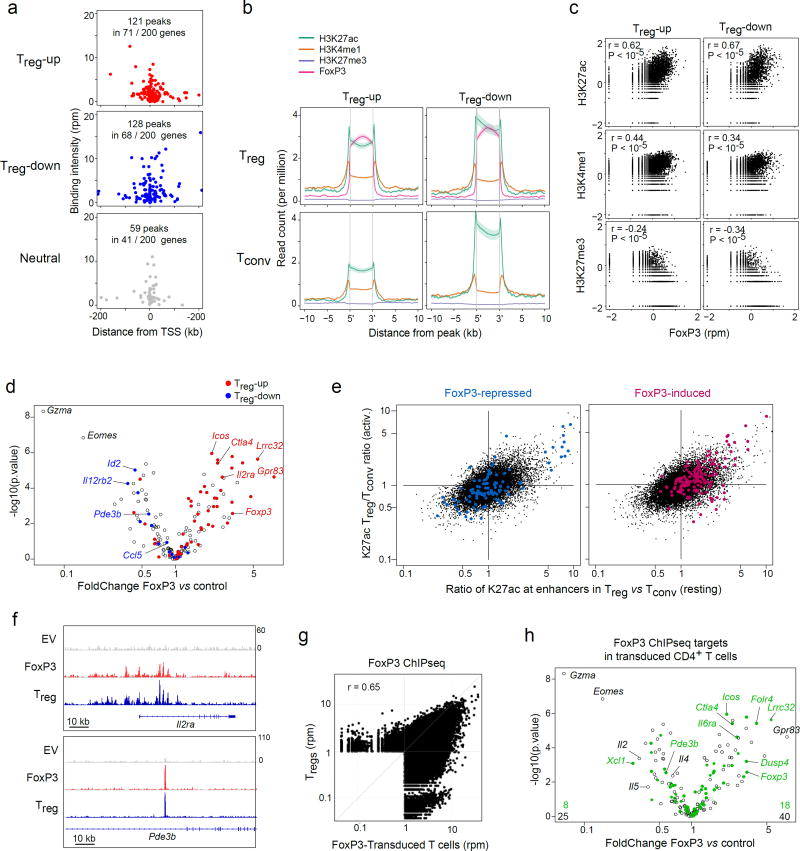
Fig. 1. FoxP3 binds to active enhancers around both Treg -up and -down loci.
(a) FoxP3 binding peaks (replicated in ChIPseq dataset 26,32) in the vicinity of genes over- or under-expressed in Treg vs Tconv cells, or random neutral genes. (b) Density of chromatin marks in a 10 kb window around FoxP3 binding sites chromatin for Treg -up- or –down genes (per a). (c) Correlation of ChIPseq signal intensity for FoxP3 vs different chromatin marks in the vicinity of Treg -up- or –down genes (Pearson r and p-value). (d) 48 hrs after transduction of activated CD4+ T cells with a retroviral vector encoding FoxP3, or an empty vector control, transcripts were quantitated by Nanostring profiling. WT/EV expression FoldChange is plotted vs t.test p.value. Transcripts belonging to the classic Treg -up or - down signatures 7 are highlighted. (e) Ratio of H3K27ac intensity in Treg vs Tconv cells (genomewide data 31); x-axis: ratio in resting cells; y-axis: ratio in activated cells; red and blue highlights represent the positions of enhancers within 50 kb of genes that belong to the FoxP3-induced and -repressed genes defined by FoxP3 transduction. (f) Binding of FoxP3 around IL2ra and Pde3b in CD4+ T cells transduced with EV or FoxP3, with traces from ex vivo Treg cells 31 for reference (bottom row). (g) Genomewide comparison of FoxP3-binding in our FoxP3-transduced CD4+ T cells vs ex vivo Treg cells 31. Representative of biological duplicates. (h) Changes induced by FoxP3 transduction (same plot as d), where green highlights denote genes that bind FoxP3 (ChIPseq analysis in transduced cells); the average of biological quadruplicates.

