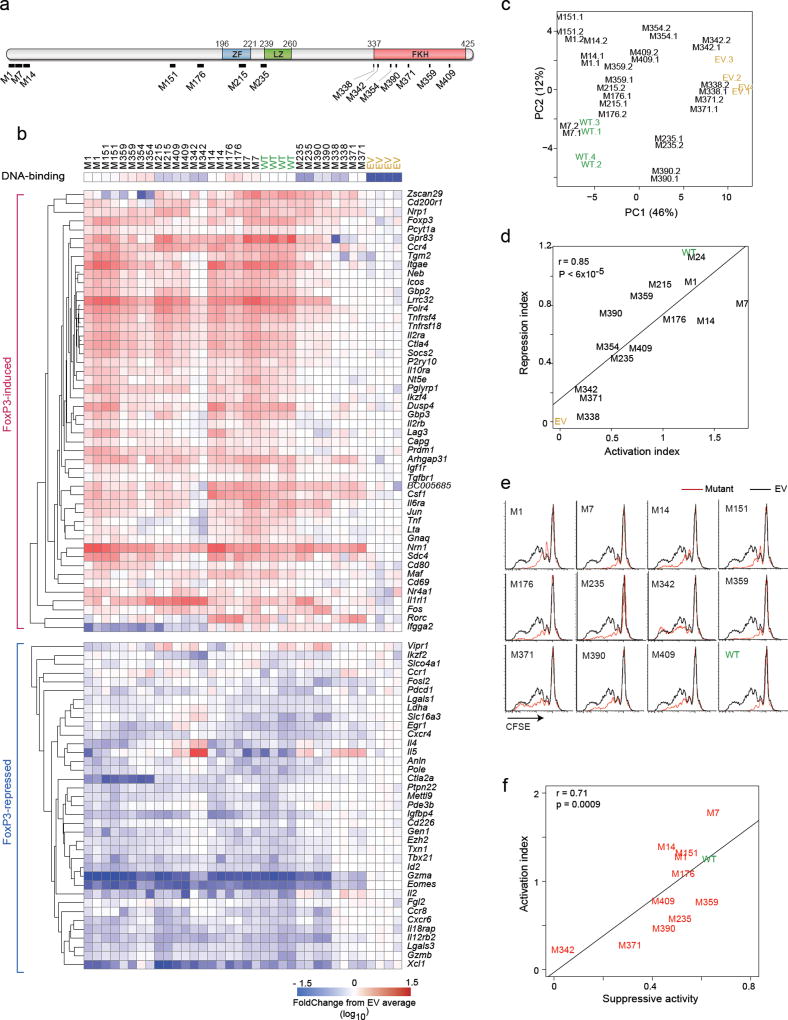
Fig. 2. Transcriptional activity of the FoxP3 mutants.
(a) Schematic of the 14 Alanine-replacement mutants of FoxP3 (details in Supplementary Table S2). (b) Transcriptional activity of the mutants. Activated CD4+ T cells transduced with retroviruses encoding mutant or wild-type FoxP3, or with empty vector and sorted at 72 hrs (matching expression of FoxP3 based on co-linear THY1.1) and profiled in biological duplicate (Nanostring); results are shown as FoldChange relative to the mean of EV controls. DNA-binding efficiency (from Supplementary Fig. 1e) is shown for reference. (c) Principal Component Analysis of data from b. Each point represents an individual experiment. (d) General activation or repression indices were computed for each mutant (average of FoldChanges for all FoxP3-induced or all FoxP3-repressed transcripts, respectively) and the two plotted. (e) Suppressive activity of CD4+ T cells transduced with wild-type or mutant FoxP3, as inhibition of division of CFSE-labeled Tconv (black: Tconv alone, red: after supplementation with transduced cells; data representative of 3 independent experiments). (f) Suppression index (from e, average of 3 experiments) plotted vs Activation Index (from d); Pearson correlation r and p-value.

